Characterization of Chemical Polishing Materials
by means of Acoustic Spectroscopy
Andrei S. Dukhin, Philip J. Goetz
(The full text of this paper has been submitted to “Colloids and Surfaces”)
Abstract.
It is shown that acoustic spectroscopy can sense the presence of a small sub-population of large particles in a concentrated dispersion of much smaller particles. The detection limit can be as low as a single one micron particle per 100,000 particles of 100 nm size. This is equivalent to a large particle content of 1 wt. % relative to the total solid content of the chemical mechanical polishing (CMP) slurry.
A model dispersion with a known bimodal particle size distribution (PSD) was created by adding a small amount of larger particles to a stable slurry containing only small particles. Dupont Silica Ludox-TM (30 nm) and Cabot SS25 (63 nm) were used to represent typical CMP slurries. Two samples of Silica Geltech (0.5 and 1.5 micron) were used to model the offending aggregate particles. It is shown that the attenuation spectra measured with the DT-1200 has sufficient sensitivity that it can detect the larger particles at concentrations as low as 2% relative to the total solid content of the slurry (12%wt). Moreover, the bimodal PSD calculated from the attenuation spectra are consistent with the known composition of these mixed model dispersions. Importantly, a software error analysis can correctly select either a bimodal distribution or a lognormal representation of the test samples.
Introduction.
Modern chemical polishing materials present a new challenge for measuring techniques. Three aspects of this application cause difficulties when using instruments based on traditional techniques. First, the particle size of a typical CMP slurry is too small for sedimentation based instruments such as Sedigraph 5100 or electric zone instruments such as a Coulter counter. Typically, the mean size of CMP materials is approximately 100 nm with no particles, or hopefully just a few, larger than 500 nm. Second, the range in the size of the particles may be greater than 1000:1 which also eliminates many classical techniques. Third, CMP systems are typically shear sensitive. Shear caused by the polishing process itself or the delivery system may cause unpredictable assembly of the smaller particles into larger aggregates. However, these aggregates may be weakly formed and easily destroyed by subsequent sonication, high shear, or dilution. Therefore, any technique which requires dilution or other sample preparation steps may in fact destroy the very aggregates that one is attempting to quantify by measurement. We suggest that CMP systems must be characterized as is, without any dilution or sample preparation..
Acoustic spectroscopy [1-3] provides an exciting alternative to more classical methods. The technique resolves all three issues mentioned above. It is known that acoustic spectroscopy is able to characterize particles as small as 10 nanometers [4] and as large as 10 microns, providing at least a 1000:1 range. Most importantly, the techniques requires no dilution and is suitable for measuring slurries, as is, up to 45% by volume [5,6]. These unique features make Acoustic Spectroscopy very attractive for characterizing the particle size distribution of CMP slurries.
However, there is one feature of Acoustic Spectroscopy which thus far has not been described sufficiently in the literature: namely the ability to characterize a bimodal PSD. Although Takeda et al [7] demonstrated that Acoustic Spectroscopy is able to characterize bimodal distributions of mixed alumina particles, the ultimate sensitivity in detecting one very small sub-population in combination with another dominant mode has not yet been investigated. Yet, it is just this feature, the ability to recognize a small sub-population, which is most critical for CMP studies. This paper addresses this important issue.
Unfortunately, there is no agreement in the literature as to the number of larger particles which might be allowed in a CMP slurry. We will assume for the moment that only 1 large particle of 1 micron size might be allowed per 100,000 small 100 nm particles. This target sensitivity corresponds to large particles amounting to 1% of the total weight of all particulates.
Of course, an Acoustic Spectrometer does not directly measure particle size. In fact, it measures an attenuation spectra and calculates the particle size assuming a certain model for describing the sound attenuation in terms of the physical properties of the system. It follows therefore that this target sub-population sensitivity needs to be translated into a corresponding precision and accuracy specification for the attenuation measurement. We will show that, from a theoretical standpoint, the required accuracy is roughly 0.01 dB/cm/MHz. The first set of experiments were performed with a single component system of Dupont silica Ludox-TM to confirm that the DT-1200 Acoustic Spectrometer indeed meets this target requirement.
A second set of experiments was then made to test whether the attenuation spectra changed reproducibly when a small amount of the larger particles was added to a single component slurry of smaller particles. Two slurries were used for the small particles: Ludox-TM and Cabot SS25. Two silica Geltech with nominal sizes 0.5 and 1.5 micron were used as the model large particles. It was shown that the change in the attenuation spectra was statistically significant when the large particles amounted to at least 2 % of the total weight of all particulates. Expressed another way, the detection limit for this 12 wt % slurry corresponded to a sub-population which was only 0.24 wt % in terms of the total sample weight, or 0.24 g of large particles per 100 g of the slurry.
Experimental Technique
For these tests we used a DT-1200 Acoustic Spectrometer developed by Dispersion Technology, Inc. [ 8 ].
Materials
We used altogether four silica materials. Two small sized particles were used, namely Dupont Silica Ludox-TM and Cabot SS25. Two larger sized particles were employed, namely Geltech 0.5 and Geltech 1.5. We assumed a density of 2.1 g/cm3 for all silica particles.
Slurries were prepared at 12 weight % for each material as follows.
The Silica Ludox-TM was supplied as a 50 %wt slurry which was diluted to 12 wt % with 0.01 M KCl solution resulting in a sample pH of 9.3.
The Geltech samples were supplied as a dry powder, which was dispersed in 0.01 M KCl solution and adjusted to pH 9.6 with KOH. The dispersion was repeatedly sonicated, stirred, and allowed to equilibrate for 5 hours before being measured.
The Cabot SS25 silica was diluted to 12 wt % with 0.01 M KCl.
Table 1 presents particle size data provided by the manufacturer for each of these samples.
Results and Discussion
The attenuation spectra obtained in the reproducibility test with the Ludox-TM slurry are shown in Figure 2. The attenuation data is also shown in Table 2 where each column corresponds to a different frequency on a log scale from 3 to 100 MHz. Importantly, we note that the small differences between these nine repeat measurements of the same sample is less than our target resolution of 0.01 dB/cm/MHz as formulated above.
We also see that the resolution in the attenuation measurement improves with frequency. It is also clear that one point at high frequency ( ~ 60 MHz ) is the least precise. This frequency corresponds to twice the resonant frequency of the acoustic transducers, at which point the transducers have a minimum conversion efficiency.
The experimental resolution obtained in this test is also plotted in Figure 1, together with theoretical requirement discussed earlier. It is seen that experimental resolution is much better than theoretically required for all frequencies but one. This means that the resolution of the DT-1200 attenuation measurement is sufficient for meeting the target set for PSD characterization of CMP slurries.
Another conclusion follows from the theoretical curves of Figure 1. We note that the addition of either the 0.5 or 1 micron particles contributes additional viscous losses and results primarily in an added attenuation at low frequencies, whereas the addition of the 3 micron particles contributes additional scattering losses which results primarily in added attenuation at the higher frequencies. It is a fortunate coincidence that this acoustic technique is particularly sensitive for distinguishing between these “large” and relatively “larger” particles. Qualitatively, we can say that an increase in the attenuation at the lower frequencies indicate that we are dealing with “large” particles of about 1 micron, whereas an increase in the attenuation spectra at higher frequencies is an indication that we have even “larger” particles exceeding 3 microns. Quantitatively, of course these calculations are made more precise by the Analysis software.
The attenuation spectra for all five single component silica slurries is shown in Figure 2 and the corresponding particle size distributions for these same samples is shown in Figure 3. These tests allowed us to compare the particle size determined by acoustic spectroscopy for the five 12 wt % test slurries with independent data from the manufacturers. The values of the median size in each case is shown in Table 1. It is interesting to note that there is some difference between the acoustically measured data and that provided by the manufacturer. In large part this is related to differences in the characterization technique. For instance, the size of the Ludox-TM slurry is determined by Dupont using a titration method. This method yields an average size on an area basis. Acoustic spectroscopy gives us a size on a weight basis which for a polydisperse system will always be somewhat larger than an area based size.
Successful reproducibility and accuracy results then encouraged us to move to the third step which is a test of the ability to correctly determine bimodal PSD. We used Ludox TM or CMP SS12 small particles as the major component of a slurry. The Geltech 0.5 or Geltech 1.5 were used as “large” and “larger” particles in the minor component of the mixed slurry. In each case the minor fraction was added to the Ludox-TM or the CMP SS12 systems in steps. Each addition increased the relative amount of the larger particles by 2%. The attenuation spectra was measured twice for each mixed system in order to demonstrate reproducibility.
Figure 5 – 8 give the results of these mixed system tests. It is seen that attenuation increases with increasing amounts of the “large” or “larger” particles. The increase in the attenuation with increasing doses of the Geltech content is in all cases significantly larger than reproducibility of the instrument. This demonstrates that the DT-1200 data contains significant information about the small amount of large particles. The final question is to determine whether the calculated PSD correctly calculates a correct bimodal distribution for these mixed model systems.
Tables 3 gives an answer to this question. The DT-1200 always calculates a lognormal and a bimodal distribution which best fits the experimental data. These two PSD are best in the sense that the fitting error between the theoretical attenuation calculated for the best PSD and the experimental attenuation is minimized. These fitting errors are important criteria for deciding whether the lognormal or bimodal PSD is more appropriate for describing a particular sample. For instance, the PSD is judged to be bimodal only if the bimodal fit yields substantially smaller fitting error than a lognormal PSD. The value for the lognormal and bimodal fitting errors are given in the Table 3. It is seen that fitting error for the bimodal PSD is better than the lognormal for all of the mixed systems over the whole range concentration and for both the large and larger sized particles. According to the fitting errors, all PSD in the mixed Ludox-Geltech systems are bimodal, which of course is correct for these known mixed systems.
Conclusions
We assumed that characterization of CMP slurries requires the detection of 1 particle with 1 micron diameter per 100,000 small particles with diameter 100 nanometers. This is equivalent to large particles having a weight equal to 1% of the total particulates in the slurry.
Experimental reproducibility and accuracy tests show that the DT-1200 Acoustic Spectrometer meets the target detection requirement for characterizing small amounts of large particles in CMP slurries.
Attenuation spectra measured using DT-1200 reflects presence of the added small amounts of large particles. Particle size distribution calculated from these attenuation spectra are bimodal according to the suggested PSD criterion. This criterion applies fitting errors analysis in order to select a proper PSD shape. It also assumes a certain constraint on the large particles content.
Content and size of the large particles calculated from attenuation spectra are in a good agreement with a’priori known amount and size of the added large particles, which shows consistency of the bimodal PSD calculated from the attenuation spectra.
References
- D.J. McClements, “Ultrasonic Characterization of Emulsions and Suspensions”, Adv. Colloid Interface Sci., 37, 33-72 (1991)
- A.S.Dukhin and P.J.Goetz, P.J., “Acoustic and Electroacoustic Spectroscopy”, Langmuir, 12 [19] 4334-4344 (1996)
- A.S.Dukhin and P.J.Goetz, P.J., “Acoustic and Electroacoustic Spectroscopy” in “Ultrasonic and Dielectric Characterization Techniques” Ed. V.Hackley and J.Texter, American Ceramic Society, 77-97, (1998).
- 15.A.S.Dukhin and P.J.Goetz, “Characterization of Aggregation Phenomena by means of Acoustic and Electroacoustic Spectroscopy”, Colloids and Surfaces, accepted, (1998)
- A.S.Dukhin and P.J.Goetz, “Acoustic Spectroscopy for Concentrated Polydisperse Colloids with High Density Contrast”, Langmuir, 12 [21] 4987-4997 (1996)
- A.S.Dukhin, H. Ohshima, V.N.Shilov and P.J.Goetz, “Electroacoustics for Concentrated Dispersions”, Langmuir, submitted (1998)
- Shin-ichi Takeda, “Characterization of Ceramic Slurries by Ultrasonic Attenuation Spectroscopy” in “Ultrasonic and Dielectric Characterization Techniques” Ed. V.Hackley and J.Texter, American Ceramic Society, 243-257, (1998).
- A.S.Dukhin and P.J.Goetz, P.J., US Patent pending
- R.R.Irani and C.F.Callis, “Particle Size: Measurement, Interpretation and Application”, John Wiley & Sons, NY-London, 1971
Table 1. Particle size of the initial silica samples, expected and measured acoustically.
| Manufacturer | Acoustics | |
|---|---|---|
| Ludox -TM | 22 nm (area basis) | 30 nm (weight basis) |
| Geltech 0.5 | 0.5 micron | 0.65 micron |
| Geltech 1.5 | 1.5 micron | 1.72 micron |
| Cabot SS12 | 63 nm | |
| Cabot SS25 | 62 nm |
Table 2. Attenuation data for Ludox TM, 12%wt, measured 9 times with 5 different loads. Each column corresponds to the different frequency from 3 to 100 MHz on the logarithmic scale. Average attenuation and average variation are shown in the 2 last rows.
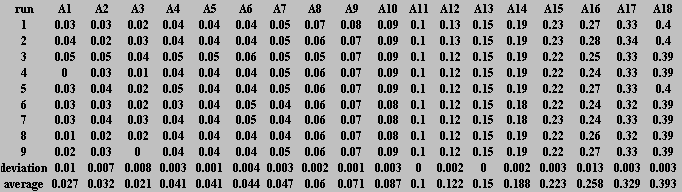
Table 3. Characteristics of the larger particles (silica Geltech) calculated from the attenuation spectra of the Figures 5 and 6.
|
Calculated for Geltech 0.5 |
Calculated for Geltech 1.5 |
|||||||
|---|---|---|---|---|---|---|---|---|
| Actual Geltech Content, % |
Content % |
Larger Size Micron |
Lognormal Fitting Error % |
Bimodal Fitting Error % |
Content |
Larger Size Micron |
Lognormal Fitting Error |
Bimodal Fitting Error % |
|
9 |
14 |
0.7 |
14.1 |
7.3 |
11 |
1.6 |
24.5 |
4.4 |
|
9 |
15 |
0.9 |
10.9 |
8.7 |
12 |
1.7 |
17.7 |
5.5 |
|
7.4 |
8 |
0.9 |
13.6 |
4.5 |
10 |
1.9 |
17.8 |
6 |
|
7.4 |
12 |
1 |
15.4 |
7.1 |
10 |
1.9 |
17.3 |
5.4 |
|
5.7 |
7 |
0.9 |
13.8 |
4.3 |
7 |
1.9 |
17.2 |
4.1 |
|
5.7 |
10 |
1.3 |
12.9 |
7.2 |
6 |
1.6 |
18.5 |
4.7 |
|
3.8 |
4 |
0.9 |
9.5 |
3.7 |
5 |
1.3 |
18.1 |
3.9 |
|
3.8 |
4 |
0.7 |
12 |
4.3 |
6 |
1.6 |
16.9 |
3.8 |
|
2 |
4 |
0.6 |
10.8 |
3.6 |
3 |
1.9 |
12.2 |
2.6 |
|
2 |
5 |
1.2 |
12.2 |
3.7 |
4 |
1.6 |
12.3 |
3.9 |
Figure 1. Theoretical and experimental resolution of the attenuation measurement. Theoretical resolution is defined as the difference between attenuation spectra corresponding to lognormal PSD with median size 50 nm and standard deviation 0.3 and bimodal distributions with 1% of solid content of large particles. Size of the large particles is shown in legend. Total solid content is 6%vl of silica with density 2.2 g/cu.cm. Experimental resolution is determined based on the data from the Table 2.
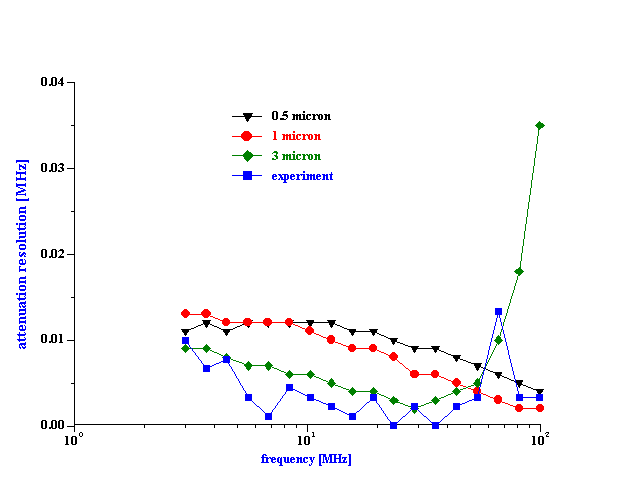
Figure 2. Attenuation spectra measured for silica Ludox TM, silica Geltech 0.5 and 1.5, silica Cabot SS25 and SS12. Total solid content is 12% wt but for SS25-25%wt.
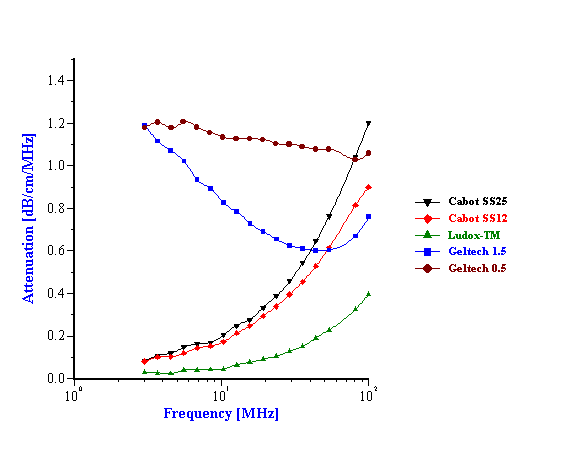
Figure 3. Particle size distributions corresponding to the attenuation spectra from the Figure 4. 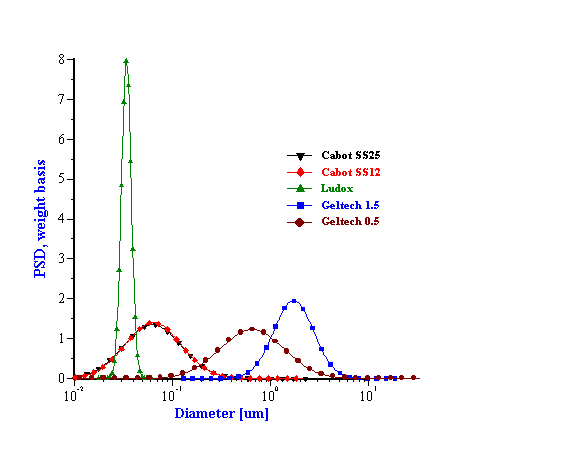
Figure 4. Reproducibility test. Multiple attenuation spectra measured for silica Ludox TM-50 with 2 different weight fractions.
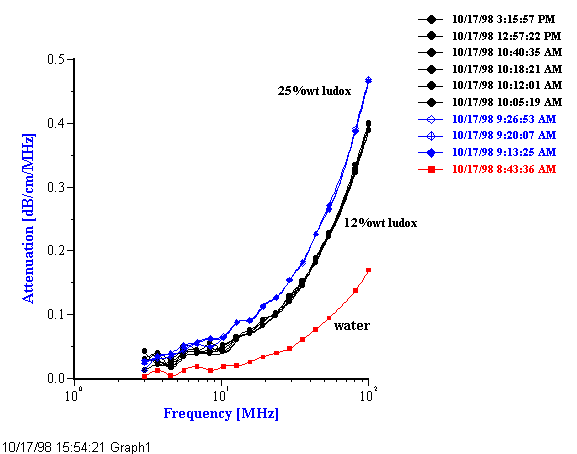
Figure 5. Attenuation spectra measured for silica Ludox TM-50 with various additions of silica Geltech 0.5. Total solid content is 12% wt. Legend shows the fraction of the total solid content corresponding to the silica Geltech.
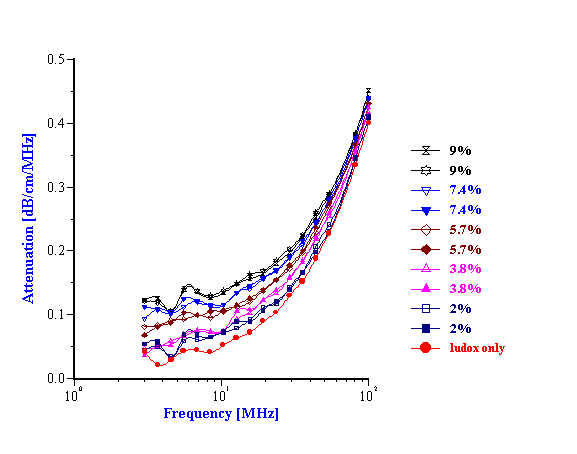
Figure 6. Attenuation spectra measured for silica Ludox TM-50 with various additions of silica Geltech 1.5. Total solid content is 12% wt. Legend shows the fraction of the total solid content corresponding to the silica Geltech.
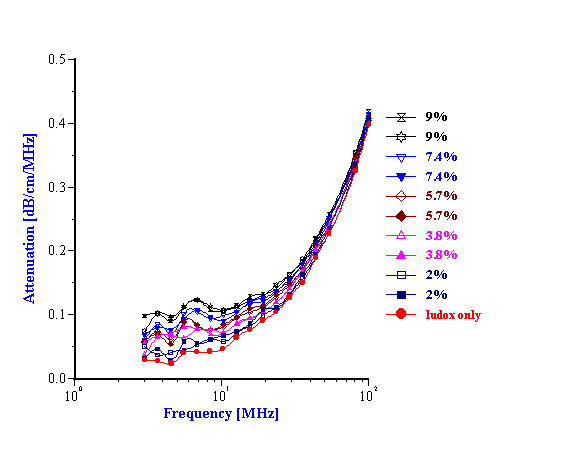
Figure 7. Attenuation spectra measured for silica Cabot SS25 diluted down to 12%wt with various additions of silica Geltech 05. Total solid content is 12% wt. Legend shows the fraction of the total solid content corresponding to the silica Geltech.
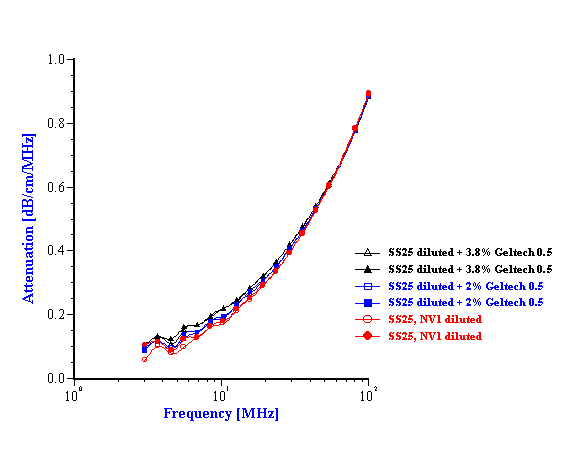
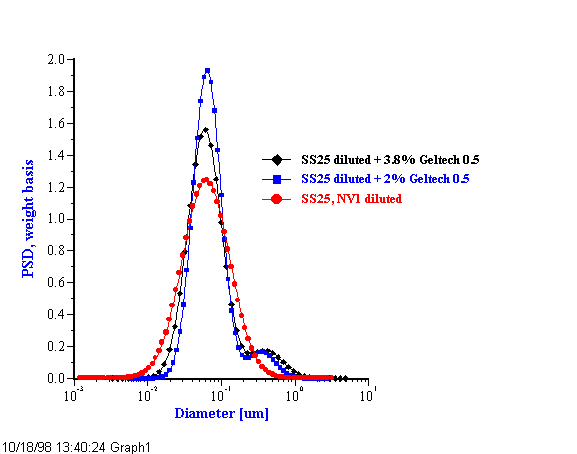
Figure 8. Particle size distribution of silica Cabot SS25 diluted down to 12%wt with various additions of silica Geltech 05. Total solid content is 12% wt. Legend shows the fraction of the total solid content corresponding to the silica Geltech.