Characterization of CMP slurries.
Part 2. A new composite method comprised of Acoustic and Electroacoustic spectroscopy and Sedimentation monitored with Ultrasound.
A complete, adequate characterization of Chemical-Mechanical Polishing slurries (CMP) is imperative for formulation of the new products and for quality control in production and during the polishing process. This characterization includes achieving of several following goals:
Determination of the size distribution of the bulk of the particles that perform polishing;
Testing for the possible presence of the small amounts of large particles that could ruin polished surface;
Characterization of aggregative stability of the slurry, desirably separating between aggregation and flocculation. Aggregation is dangerous for the polishing, whereas lose flocs unlikely to damage the polished surface;
Measurement of the electric surface properties, like zeta potential, which affect particle-surface and particle-particle interactions.
At the time being different instrument are used for performing some of these tasks. For instance, light scattering instruments yield information about particle size distribution (task 1) and large particles fraction (task 2) in most laboratories and plans. This method requires a special sample preparation, including dilution and often sonication, which might be allowed for achieving the first two tasks, but completely forbidden for the last two.
Ultrasound based techniques open a new possibilities for performing this complete characterization procedure, eliminating sample preparation step. This makes possible to characterize CMP continuously, even on-line, and improves significantly reliability, reproducibility and completeness of the results. In this newsletter we show with 5 different slurries how Ultrasound based techniques allow us to perform this characterization procedure and to reach the goals 1, 3 and 4.
Concerning goal 2, we had shown in our previous newsletter dedicated to the CMP slurries (Part 1. “Resolution of Acoustic Spectroscopy in characterization of the large particle content in CMP slurries”, www.dispersion.com ) that Ultrasound cannot compete with counting methods, in particular, Accusizer from PSS.
There is one important innovation in the way we apply Acoustics and Electroacoustics here. Usually, Acoustic spectrometer measures individual attenuation frequency spectra (raw data) with further particles size distribution (PSD) calculation, using appropriate theory. Electroacoustic instrument measures electroacoustic signal (either CVI or ESA) that provides information about zeta potential.
In this study we use both these techniques in their traditional modes. In addition, we apply them for monitoring Sedimentation kinetics of the CMP slurries. This is a new dimension in the characterization procedure, which turns out to be very useful, especially in determining rheological properties of the particles formations in the unstable systems.
Figure 1. Scheme of the DT-1200 sample chamber with Acoustic and Electroacoustic sensors.
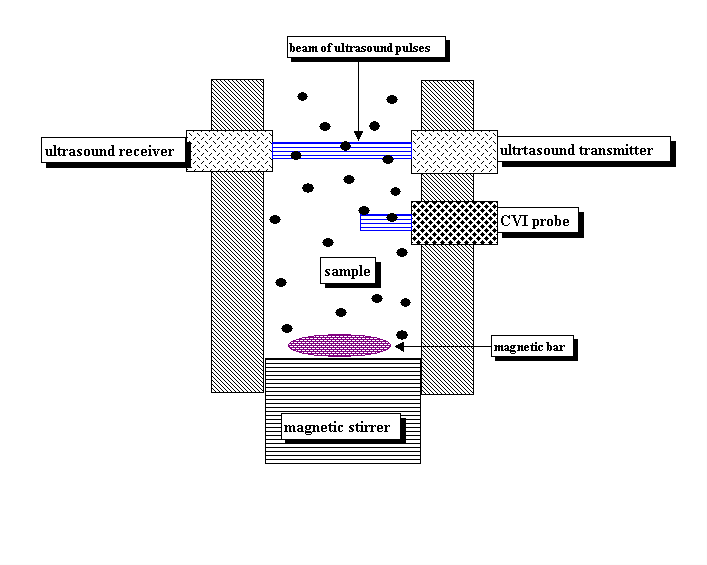
This new method becomes easily available due to the peculiarities of the DT-1200 sample chamber design, which is illustrated on Figure 1. Acoustic and Electroacoustic sensors are placed inside of the walls of the vertical shaft 2.5 cm wide and 10 cm deep. There is a stirrer on the bottom of the chamber. This stirrer mixes sample by vortex and by pumping it from the bottom to the top through the pipe that is not shown on the Figure 1.
If stirrer is off and particles are large enough for sedimenting, they would cross lines of the ultrasound field generated by Acoustic and Electroacoustic sensors. Eventually this would lead to the changes of the sample composition within the range of sensors. This would affect measured attenuation spectra (Acoustic sensor) and CVI (Electroacoustic sensor). Plotting raw data versus time we could derive important conclusions about sample stability, properties of the particles aggregates and flocs.
In some sense, DT-1200 becomes similar to Sedigraph. Instead of X-rays for monitoring sedimentation kinetics, we use Ultrasound.
Slurries of this study include two silica slurries, two ceria slurries and one alumina slurry. According to our characterization procedure, they represent 3 different cases of stability.
Silica slurries turn out to be stable in both, sedimentation and aggregation sense.
Ceria slurries are flocculated, with particles retaining independent motion within the flocs.
Aumina slurry contained two different fractions: 75% of small stable particles and 25% of very large rigid aggregate with high water content and yet no independent primary particles motion.
The following sections illustrate this method in details for each of the slurry. They give justifications of the next set of conclusions:
CONCLUSIONS
Absence of the time dependence of the measured attenuation and/or CVI indicates that CMP is stable and does not contain large particulate entities.
Standard deviation of the Acoustic attenuation characterization of the median and mean particle size of the concentrated intact CMP slurry is in the range 1-3 nanometers.
Acoustic attenuation measurement yields information about size of the entities moving under a stress. This size might be substantially less than size output of the light based instruments. This is observed especially for fumed silica slurry that contains aggregates of the primary particles. Acoustics yields information of the size this aggregates reduced to under influence of stress imposed by ultrasound.
Characterization of zeta potential for CMP slurry requires taking into account surface conductivity effects that might be achieved with independent conductivity measurements and adequate theoretical treatment.
Decay of attenuation with time at the same rate for all frequencies (parallel shift) indicates flocullation of colloid with rather narrow PSD.
CVI time dependence in conjunction with attenuation time dependence corresponds to flocculation with particles retaining their independence within the flocs.
Decay of attenuation with time at the different frequency dependent rate (assymetric shift) indicates either aggregation or rather broad PSD.
Time independence of CVI indicates either stability of the colloid, or aggregation, when attenuation is time dependent.
Silica CMP.
We used 2 silica CMP slurries with 10% and 50% by weight solid content.
Both samples were measured 200 times continuously with no stirring. Each set measurement takes about 18 hours. There is no time dependence of either attenuation or CVI has been observed. Figure S.1 Shows starting and final attenuation spectra for both samples. Figure S.2 shows attenuation at the frequency 12.8 MHz, versus time. It is seen that attenuation changes within DT-1200 precision limit of 0.01 dB/cm/MHz. Figure S.4 shows no time dependence of the CVI measurement.
All this indicates that both silica slurries are perfectly stable in both sedimentation and coagulation sense, and allows us to formulate the following conclusion.
Conclusion 1. Absence of the time dependence of the measured attenuation and CVI indicates that CMP is stable and does not contain large particulate entities.
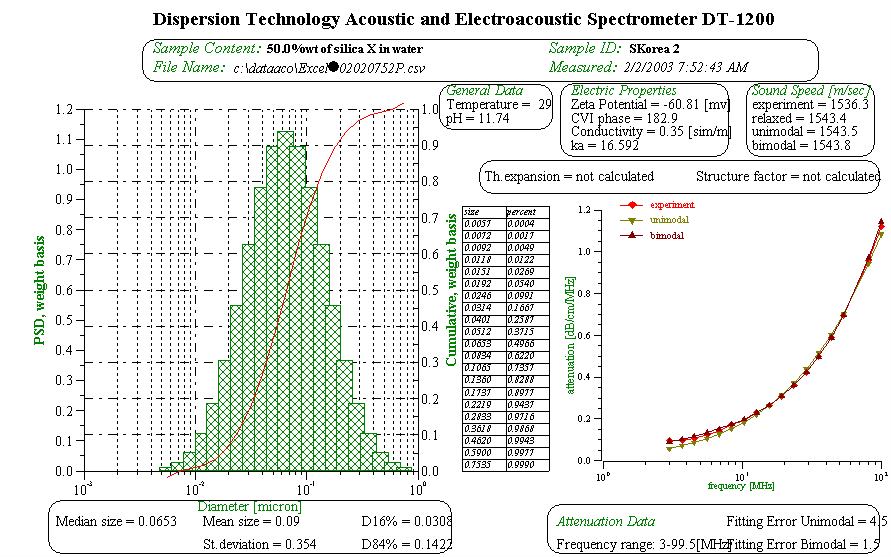
Figures S.3, 5 and 6 illustrate particle size distribution calculated from attenuation spectra. Statistical analysis reveals that standard deviation of the median particle size characterization is 0.4 nm for 10% slurry, and 1 nm for 50% slurry. Standard deviation of the mean particle size characterization is 2 nm for 10% slurry and 0.3 nm for 50% slurry. This allows us to formulate the next conclusion.
Conclusion 2. Standard deviation of the Acoustic attenuation characterization of the median and mean particle size of the concentrated intact CMP slurry is in the range 1-3 nanometers.
It is important to mention here that there is possible difference in the size output between light and ultrasound based instruments. Ultrasound, even the weak non-destructive one, applies stress to the particles. If particles are aggregates, like fumed silica, this stress deforms them and perhaps might even break them. Consequently, ultrasound yields particle size of the entities that are moving under condition of stress. This size might be smaller than size output of the light based instruments. This is especially important for fumed silica slurries. This leads us to the following conclusion:
Conclusion 3. Acoustic attenuation measurement yields information about size of the entities moving under a stress. This size might be substantially less than size output of the light based instruments. This is observed especially for fumed silica slurry that contains aggregates of the primary particles. Acoustics yields information
There is one important peculiar feature of zeta potential characterization has been discovered. It is known that there are several versions of theories for calculating zeta potential from electroacoustic signal [1]. One of the assumptions that are widely used is negligible surface conductivity in the particles double layer (DL). If we neglect surface conductivity, zeta potential of 50% slurry is –50 mV, and of 10% slurry is about -39 mV.
It turns out that this assumption is not valid, at least for these particular silica slurries. DT-1200 gives an opportunity to take into account surface conductivity by additional conductivity measurement and appropriate software.
Conductivity turns out to be quite different for these two silica samples: 0.35 S/m for 50%wt sample and 0.13 S/m for 10%wt. This numbers allows us to calculate k a (DL thickness ratio to the particle size) and then Dukhin number (see Lyklema “Foundation of Colliid Science”[2]). Dukhin number characterizes contribution of the surface conductivity. The final expressions for CVI with surface conductivity contribution are given in our book [1], Chapter 5.
After taking into account surface conductivity both of them becomes equal roughly –60 mV (see Figure S.4). This allows us to formulate the next conclusion:
Conclusion 4. Characterization of zeta potential for CMP slurry requires taking into account surface conductivity effects, that might be achieved with independent conductivity measurements and adequate theoretical treatment.
Figure S.1. Starting and final attenuation spectra of the 200 measurements sets for 2 silica CMP slurries.
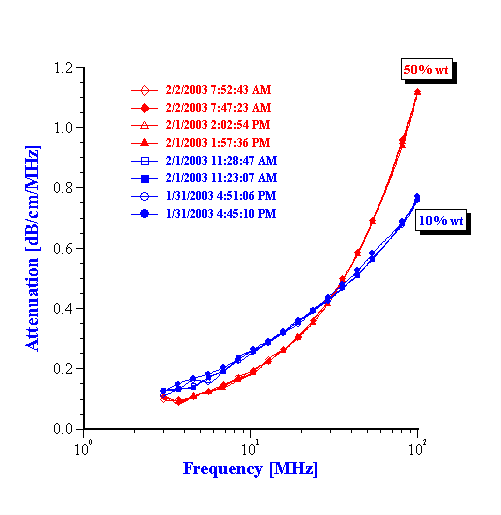
Figure S.2. Attenuation at the frequency 12.8 MHz versus time for both silica CMP slurries with no stirring.
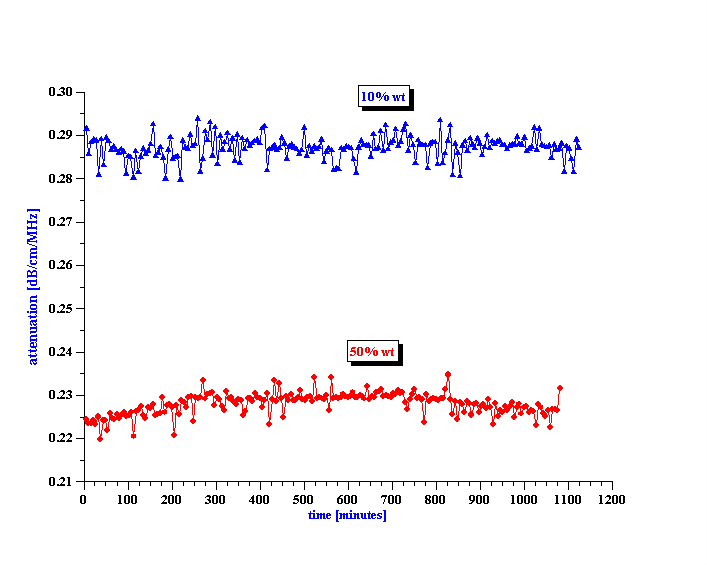
Figure S.3. Median and mean particle size calculated from the attenuation spectra for both silica CMP slurries.
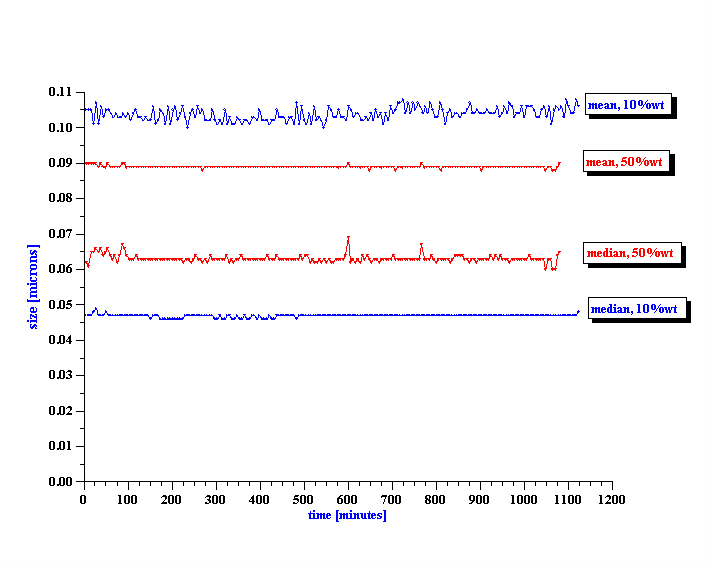
Figure S.4. CVI and calculated zeta potential for both silica CMP slurries versus time with no stirring.
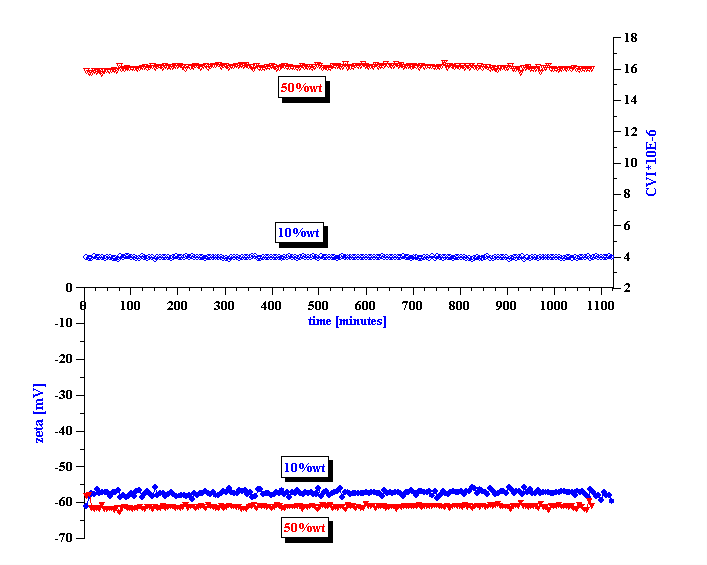
Figure S.5.
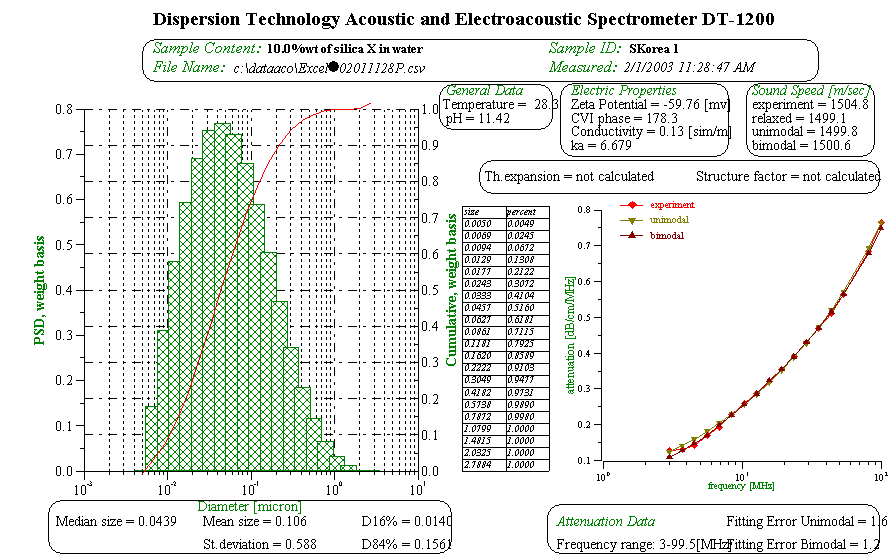
Figure S.6.
Ceria CMP.
There are two ceria samples involved in this study, both at 3%wt. We call them samples 3 and 4 for distinguishing results. This samples build up deposit over the time that indicates at least sedimentation instability. We sonicated them before measurements in order to redisperse the sediment.
Sedimentation test revealed pronounced time dependences for both samples. Figures C.1 and 2 shows that attenuation shifts down with practically same rate for all frequencies – parallel shift. At the same time rate of this shift is very different between samples. According to the Figure C.3 sample 4 exhibits much higher sedimentation rate than sample 3.
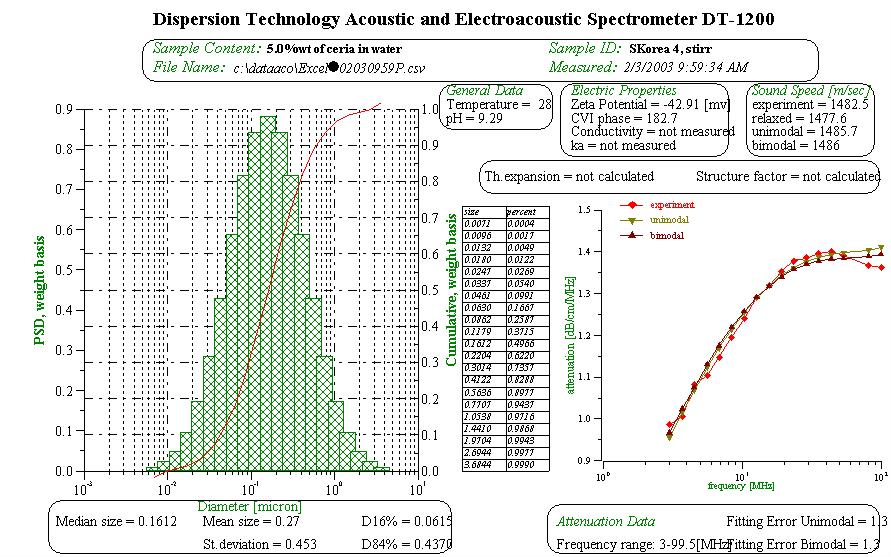
The first step in explanation this peculiarity of the ceria samples is calculation of the primary particles size distributions. We can do this using attenuation spectra under stirring conditions. Figure C.4 shows that these attenuations are quite reproducible. Corresponding PSDs are given on Figure C.6, 7 and 8. It is seen that particle size distributions are very close for both samples. Difference between them certainly cannot explain dramatic difference in sedimentation rate.
There is only one reasonable explanation left – both ceria samples are flocculated. We have to eliminate aggregation leading to the rigid aggregates because particles within aggregates would not contribute to the attenuation curve and CVI, one the one side. On the other side we would observe asymmetry in the attenuation curve shift because aggregates with larger size would sediment much faster (we will see this case for the alumina slurry). We can formulate the following conclusion:
Conclusion 5. Decay of attenuation with time at the same rate for all frequencies (parallel shift) indicates flocullation of colloid with rather narrow PSD.
Time dependence of the CVI (Figure C.5) confirms this conclusion. If particles would be trapped in the large rigid aggregates, they would lose ability for independent motion and would not contribute to the CVI. Contribution of the large aggregates to CVI is also negligible because of the size related inertia effect (see [1], Chapter 5).
Conclusion 6. Time independence of CVI indicates either stability of the colloid, or aggregation, when attenuation is time dependent. CVI time dependence in conjunction with attenuation time dependence correspond to flocculation.
Difference of the sedimentation rates between two ceria samples indicates that sample 4 is more flocculated than sample 3, its flocs larger and, perhaps, more dense. It is interesting to mention that this difference in flocculation properties is independent on zeta potential. According to the numbers on Figures C.7 and 8 this parameter is practically identical for both samples.
Figure C.1. Attenuation spectra selected with sufficiently large time intervals for proper plotting from the complete time set for the sample 3.
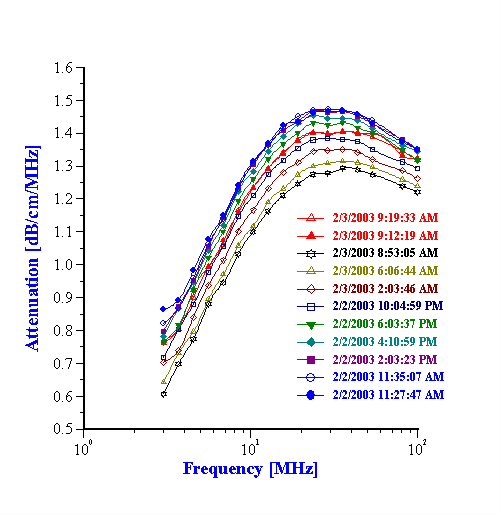
Figure C.2. Attenuation spectra selected with sufficiently large time intervals for proper plotting from the complete time set for the sample 4.
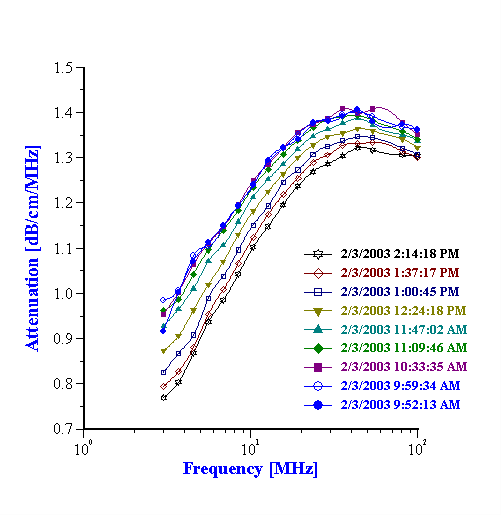
Figure C.3. Attenuation at the frequency 12.8 MHz versus time for both ceria samples.
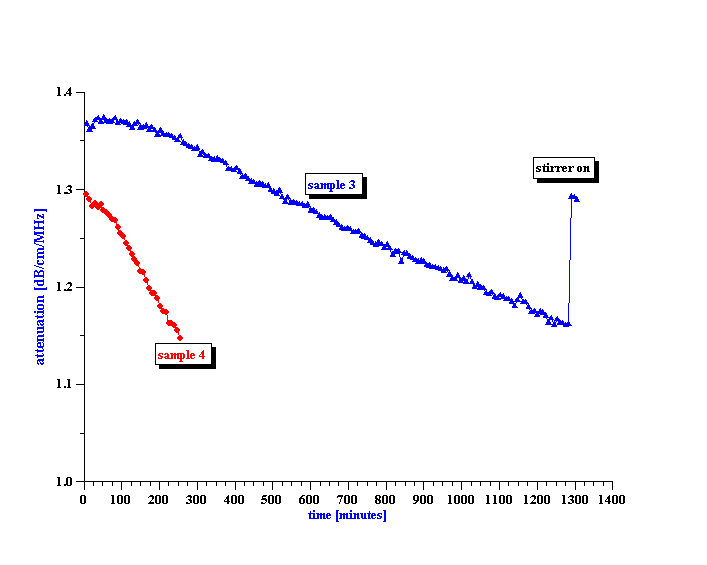
Figure C.4. Initial attenuation spectra for both ceria samples under stirring conditions. .
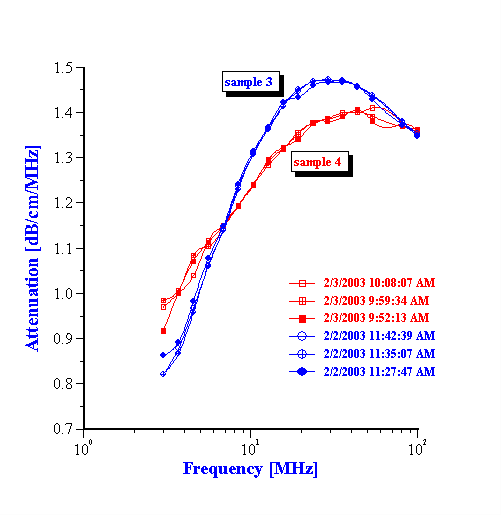
Figure C.5. Time dependence of CVI of the sample 3.
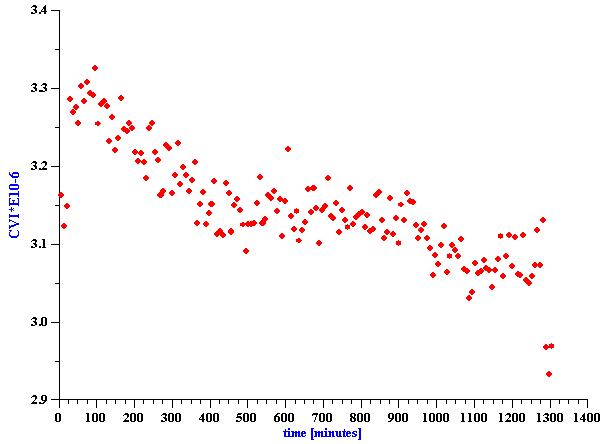
Figure C.6. Particle size distributions calculated for both samples from the initial attenuation spectra when samples are stirred..
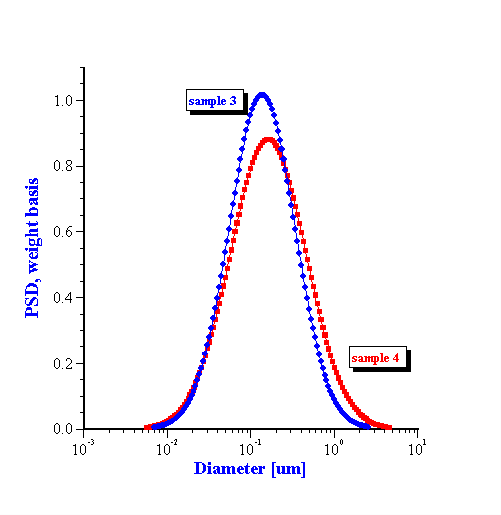
Figure C.7.
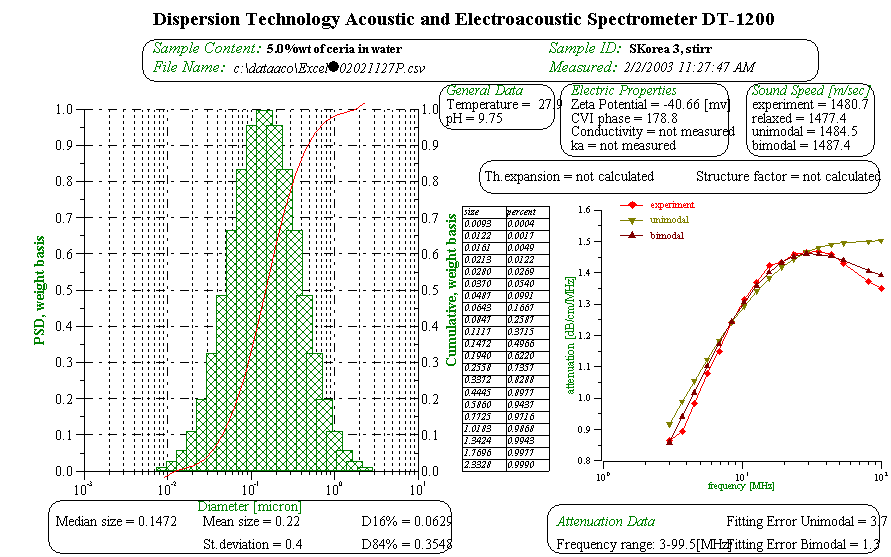
Figure C.8.
Alumina CMP.
Sedimentation properties of the alumina slurry that we used in this project, indicate that it is not stable. It builds up clearly visible deposit, which can be easily redispersed by simply shacking. This points toward flocculation. Aggregation that leads to the formation of rigid compact aggregates usually requires a high power for redispersing sample, if it is even possible.
Optical properties of the sample indicate broad particle size distribution because it remained opaque even after 30 hours sedimentation.
Starting measurements of attenuation under stirring conditions reveal very unusual attenuation curve. It is shown on Figure A.1, the highest attenuation reaching 4 dB/cm/MHz at low frequency. Normally we attribute this high attenuation at low frequency to bubbles. However, bubbles attenuation is not that much reproducible as we observe here.
There is only one other possible explanation: ultrasound scattering produced by large particles with very peculiar internal rheology. There is a simple way to determine a size of these large particles. According to the scattering theory, mean diameter is roughly equal to the 2/3 of the wavelength at the frequency that corresponds to the maximum attenuation. In this case this frequency is about 3 MHz with wavelegth 1 mm. This yields 500 microns for the size of the particles that cause low frequency attenuation.
The question arises what is the nature of these particles? Is it possible to prove that it is particles, but not bubbles, causing observed anomalous low frequency attenuation.
In order to get answer to this question we turned off stirrer and run continuous measurements over following 30 hours. Figures A.1 and 2 illustrate results of this so-called “time titration” in DT-1200 software.
It turned out that attenuation at low frequency decays with time, reaching stable level roughly after 30 hours. Attenuation at high frequency remains practically unchanged, at 100MHz it is 0.457 dB/cm/MHz with standard variation of only 0.006 dB/cm/MHz .
In order to resolve bubbles-large particles dilemma, we turned stirrer on after 30 hours. Attenuation at low frequency sharply increased, which proves that we are dealing with large particles, but not bubbles. DT-1200 stirrer has no means to inject air into the sample. Low frequency attenuation has not reached initial level prior to the sedimentation test due to the possible adhesion of the large particles to the walls and tubing, their capture in the valve dead space.
This simple sedimentation test allows us to conclude that alumina sample contains two rather different fractions of alumina particles: fraction of the stable rather small primary particles and another fraction of large flocs. Stable primary particles causes attenuation at high frequency, whereas flocs generate attenuation at low frequency.
In order to determine the relative contribution of these fractions, we fill 100 ml graduate cylinder with the sample and let it sediment. We measured weight of the sediment after 24 hours. It turns out to be 0.7 g. This means that roughly 25% of alumina particles build flocs, other 75% of the alumina particles remains stable.
It is interesting that alumina particles within the floc do not contribute to the high frequency attenuation. Otherwise we would observe time dependence of the high frequency attenuation, which has not happened. It is possible only if primary alumina particles lose ability for independent motion within a floc. This important conclusion can be confirmed with Electroacoustic data.
Measured CVI remains practically unchanged during 30 hours of time titration. Figure A.3 shows this as practically constant, time independent, zeta potential. This is possible only if particles within sedimenting flocs do not contribute to the CVI, which proves that these particles are immobile.
We can conclude that according to both Acoustics and Electroacoustics flocs are quite rigid, particles within the flocs lose their independent motion. This conclusion might have serious implication for using this slurry for chemical-mechanical polishing.
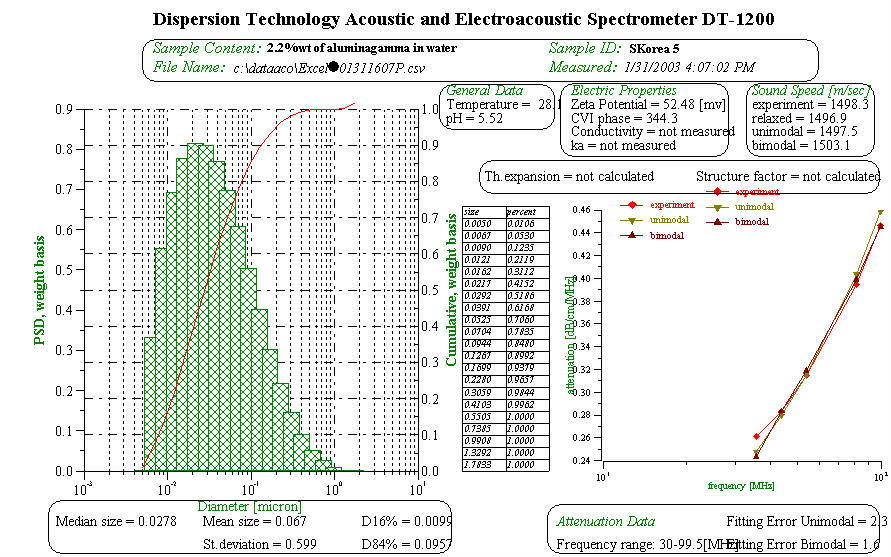
High frequency part of the attenuation spectra (>30 MHz) yields sufficient information for calculating particle size of the primary alumina particles. It is shown on Figure 5 together with theoretical fit to the experimental high frequency attenuation. Median size is 28 nm, mean size is 67 nm, assuming density of particles 3.5 g/cu.cm, weight fraction of these particles is 2.2%.
The complete particle size distribution of this sample, including primary particles and large flocs is shown on Figure A. 4.
Figure A.1. Attenuation spectra selected in intervals of roughly 4 hours from a set of 360 continuous measurements. First and last three measurements were made with stirring, it was off for all other measurements. Variation of the attenuation reflects sedimentation of the flocs.
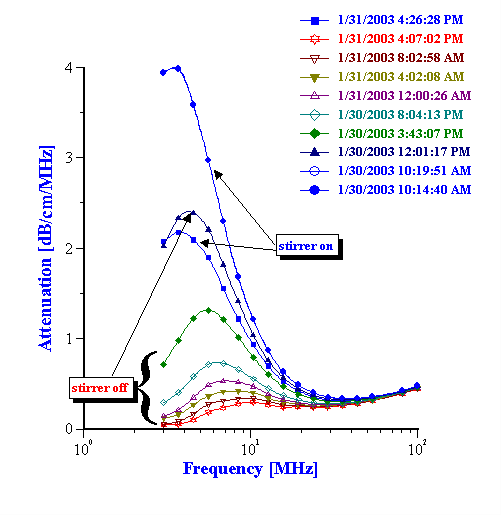
Figure A. 2. Attenuation versus time for several most representative frequencies. Attenuation at high frequency remains practically unchanged, whereas attenuation at low frequency changes dramatically. This illustrates that only one fraction of particles is involved in sedimentation, whereas other particles remain stable and determine attenuation at high frequency.
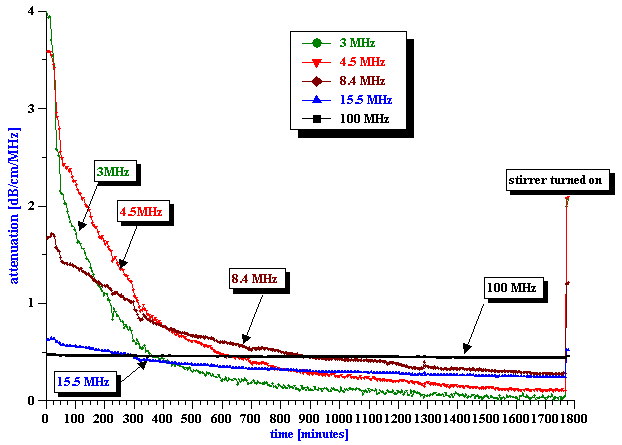
Figure A.3. Zeta potential versus time, 360 continuous measurements with variation about 0.3 mV.
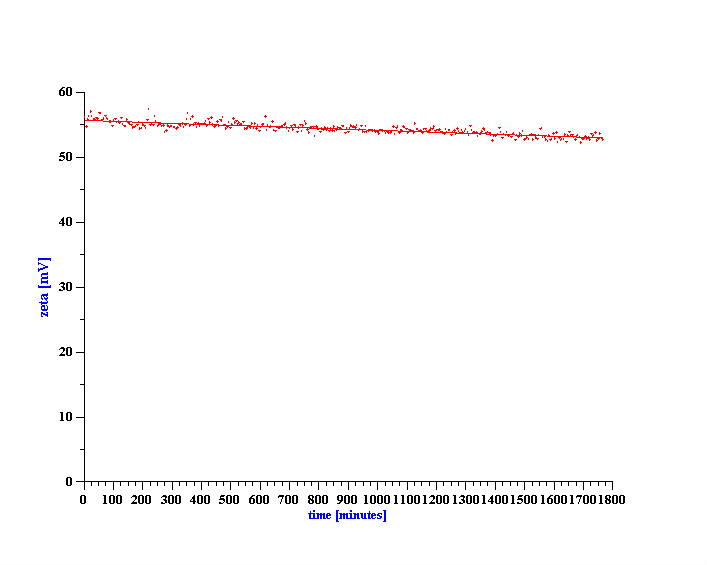
Figure A.4. Particle size distribution of the unstable alumina CMP slurry, including primary particles and rigid flocs with large water content. Particles within the floc do not retain independent motion, they are linked into rather rigid structure.
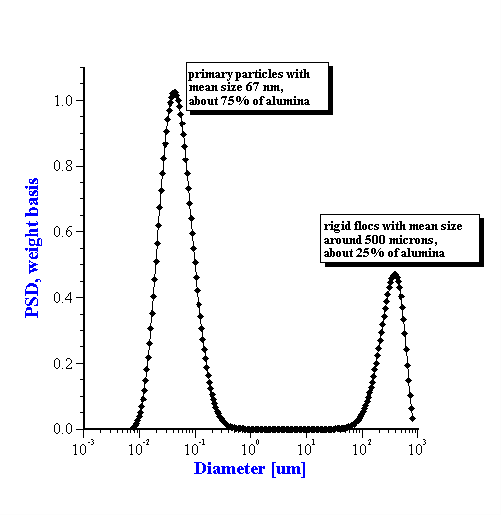
Figure A. 5. Particle size distribution calculated from the high frequency attenuation after 30 hours of sedimentation, assuming that only 75% of particles remain in the solution and contribute at high frequency. Density of particles is 3.5 g/cu.cm.
