Characterization of Mixed Dispersions by means of Acoustic Spectroscopy
Introduction.
Many natural or man-made dispersed systems contain more than one dispersed phase. For instance, blood has different types of the cells, paint usually consists of latex with added pigment, and sun-screen preparations include both an emulsion as well as sun-absorbing dispersed particles. A list of such important mixed systems is very long. There is a strong need in many cases to know the particle size distribution of one or more ingredient in such mixed systems. Light-based techniques are not capable of providing information on such real-world samples because optical methods normally require the sample to be diluted prior to measurement, thereby distorting or destroying altogether the particle size information being sought.
In contrast, acoustic attenuation spectroscopy [1-3] opens an opportunity to eliminate this dilution step and thus preserve the PSD information of the original sample. It is now well known that acoustic spectroscopy is able to characterize particles size at concentrations up to 45% by volume [3-5]. This unique feature make acoustic spectroscopy very attractive for characterizing the particle size distribution of real-world dispersions.
Importantly, there is one feature of acoustic spectroscopy which thus far has not been described sufficiently in the literature: namely the ability to characterize dispersions with more than one particle size mode. Whereas there are several papers [6-9] which demonstrate that acoustic spectroscopy is able to characterize bimodal distributions in dispersions where both modes are chemically identical, it is less well known that acoustics is also suitable for characterizing mixed dispersions where each mode is chemically quite different. The goal of this paper is to explore this capability of acoustic spectroscopy to characterize mixed systems of dissimilar materials..
Of course, an acoustic spectrometer, or for that matter any light scattering instrument, does not directly measure particle size. In fact, any technique based on some macroscopic measurement follows more- or- less a general four-step procedure. First we measure an acoustic attenuation spectra (or some optical property in the cases of light-based instruments). Second, we make certain assumptions in translating the real-world sample into a model colloid system more amenable to theoretical treatment. Third, we need some predictive theory which allows us to compute the acoustic attenuation in terms of these model parameters (Mie or Fraunhofer theories in the cases of light scattering). Lastly, we need an analysis algorithm that can search for a PSD, which according to the prediction theory and our model colloid yields a theoretical attenuation spectra that best matches the experimental spectra. The prediction and analysis appropriate to acoustic spectroscopy are not the topics of this paper as they are well described elsewhere[10] Rather, we want to describe in this paper two quite different ways of interpreting the real world in terms of our model colloid: a “multi-phase” and an “effective media” approach.
In the “multi-phase” model we assume that we can represent the real world dispersion as a sum of separate lognormal distributions, one for each component in the mixed system. For the present paper we assume that we have only two components which therefore reduces the total PSD to a bimodal particle size distribution. When we calculate the attenuation of such a multi-phase system we take into account the individual density and other particles properties for each component in the mixture. For a bimodal case, the multi-phase approach would typically require the analysis algorithm to fit six adjustable parameters: the median size and standard deviation of both modes and the relative mass fraction of each mode. In this work we will assume that the weight fraction of each mode is known in advance. Furthermore, in an effort to avoid the well known problem of multiple solutions, we will further assume that both modes have the same standard deviation. Altogether, these simplifications reduces the number of adjustable parameters to just three: the median size of each mode and the standard deviation. The implications of these simplifications will be discussed later.
In contrast, the “effective media” model assumes that we are particularly concerned with determining the PSD of just one particular component in the mixed system. All other disperse phases are lumped together into an effective homogeneous media characterized by some composite density, viscosity and attenuation parameters. As a result of adopting this viewpoint, we very significantly reduce a complex real world mixture to a quite simple dispersion of the selected dispersed phase in a newly defined “effective media”. We need not even define the exact nature and composition of this new media since we can simply measure or perhaps calculate the required composite density, viscosity and attenuation. If we assume that the key disperse phase can be described by a lognormal distribution then we have reduced the degree of freedom to just two adjustable parameters, a median size and standard deviation.
All other components of the dispersions are described as a homogeneous “effective media” with certain new properties. In order to determine these properties we need to have this “effective media” available for experimental measurement. This is perhaps the biggest disadvantage of this approach because it means that we need to perform an additional experiment. This experiment is not possible if this background “effective media” dispersion is not available.
In this paper we evaluate the use of both the multi-phase and the effective media model to the same set of experimental data. As a result we gain a better understanding of the restrictions and benefits of each method. The multi-phase approach is suitable for samples where the real system can be adequately represented by just a few disperse phases which are well characterized and where it is desired to measure the PSD for both components. In contrast, the effective media approach is particularly useful in very complex multi-component mixtures which may individually be poorly defined and it is desired to measure the PSD of only a single added component.
As we noted earlier, there are at least three quite different approaches for interpreting acoustic attenuation spectra. First, we can simply compare spectra of different samples to test if the sample is changing with time or similar to some other “good” or “bad” sample without even trying to interpret any size information. Second, if we think we know the particle size we can assume the real dispersion conforms to some model, use some predictive theory based on this model to estimate the resultant attenuation, and test whether this prediction is experimentally confirmed. Third, we can take the ultimate leap and use some analysis algorithm to search for that particle size distribution which in accordance with the model and the predictive theory best matches the experimental data.
We have been discussing so far only the use of the multi-phase and effective media model as it relates to the analysis problem of calculating particle size. The other side of the coin is to look at the use of these two model in combination with only the prediction theory, without regard for any analysis. As will be shown, such prediction by itself can be quite useful.
For example, consider the case where we construct a mixed system by simply blending two single component slurries. The PSD of the single component systems can be measured prior to blending the mixed system. Since we have control of the blending operation we know precisely how much of each component is added. If we assume that the combined PSD is simply a superposition or summation of the component parts, we are in effect saying that there is no interaction between the components. The prediction theory then allows us to compute the theoretical attenuation for this mixed component PSD. If the experimental attenuation spectra matches the theory then the assumption that the particles did not interact is confirmed. However, if the match is poor, then it is then likely that the mixing of the two component caused some change in the aggrgative behavior of the system. Perhaps new composite particles were formed by joining the two species of particles together. Perhaps some chemical component in one sample interacted with the surface of another. Many possibilities exist. Nevertheless, it seems appropriate to conclude that a necessary condition to rule out aggregation on mixing is that the experimental and predicted attenuation curves match. In addition we can probably also conclude that an error between theory and experiment is sufficient to say that aggregation on mixing has occurred. We will show that such prediction arguments are indeed able to monitor such aggregation phenomena.
Materials and Experimental Protocol.
We used three pigments from Sumitomo Corporation: AKP-30 alumina (nominal size 0.3 micron), AA-2 alumina (2 microns) and TZ-3YS zirconia ( 0.3 micron). In addition we used precipitated calcium carbonate (PCC) supplied by Specialty Minerals Corp. ( 0.7 micron) and Geltech silica (1 micron).
Slurries of the AA-2 alumina, and the zirconia were prepared in such a manner as to have quite good aggregative stability. Each slurry was prepared at 3% vol. by adding the powder to a 10-2 mol/l KCl solution, adjusted initially to pH 4 in order to provide a significant zeta potential. Although the alumina showed very quick equilibration, the zirconia required about two hours for the zeta potential and pH to equilibrate as shown in Figure 1. Both slurries were judged to be quite stable under these conditions as indicated by the absence of any noticeable settling..
Preparation of a 3 % vol. PCC slurry was more problematic since the zeta potential right after dispergating was very low (1.3 mV). Control of pH alone was insufficient and we therefore used sodium hexametaphosphate in order to increase the surface charge and improve the aggregative stability of this slurry. In order to determine the optimum dose we ran a zeta potential titration, the results of which is shown in Figure 2 The zeta potential reaches saturation at a hexametaphosphate concentration of about 0.5% by weight relative to the weight of the PCC solid phase.
The Geltech silica and the AKP-30 alumina were used only as dry powders, being added to the PCC slurry as needed.
The goals of the experiment were met in the following steps.
Step 1.Preparation of three single component slurries of alumina AA-2, zirconia and PCC respectively as described above.
Step 2. Measurement of the attenuation spectra of these single component slurries and calculation of the particle size distribution for each.
Step 3. Preparation of three mixed alumina/zirconia slurries by blending above slurries in different proportions and measurement of the attenuation spectra for each mixture.
Step 4. Addition of Geltech silica powder to the initial PCC slurry and measurement of the attenuation spectra for this mixed system.
Step 5. Addition of AKP-30 alumina powder to the initial PCC slurry and measurement of the attenuation spectra for this mixed system.
Step 6. Calculation of particle size distribution of all mixed systems using “multi-phases model”.
Step 7. Calculation of properties of the “effective media” for all mixtures.
Step 8. Calculation of particle size distribution of all mixed systems using “effective media model”.
Step 9. Comparison of results of the particle size calculation using two different approaches.
Step 10. Application of the Prediction method to the slurries with questionable PSD in order to test them for possible particles aggregation.
Results and Discussion
The experimental attenuation spectra for the three single component slurries and five mixtures are shown in Figures 3 and 4. In order to demonstrate reproducibility, each sample shown in Figure 3 was measured at least three times. Mixture 1, in fact was measured yet a fourth time after a fresh sample was loaded just to show that sample handling was not a factor. It is clear that the reproducibility is sufficient for resolving the relatively large differences in attenuation between different samples.
The attenuation spectra for the single component slurries of the AA-2 alumina, the zirconia and the PCC allows us to calculate the particle size distribution for each of these materials. The calculated sizes are given in the Table 1 and Table 2 and it is seen that these acoustically defined sizes agree quite well with the nominal sizes given by the producers of these materials.
As shown in figures 3 and 4, the attenuation spectra of the mixtures differ significantly from the attenuation spectra of the single component slurries. This difference in the attenuation spectra reflects the differences in both the particle size distributions and the density of the constituent components in the mixtures.
We want to compare the effectiveness of the “multi-phase” and the “effective media” approach in calculating the PSD of these five different mixed systems.
First let us consider the more or less straightforward “multi-phase” model. To use this approach we need only know the weight fraction and density of both disperse materials. The present software implementation assumes that the total particle size distribution is bimodal and that each mode corresponds to one disperse phase material. For instance in the alumina/zirconia mixture the smaller mode corresponds to the zirconia and the larger to the alumina. The software takes into account the difference in densities between materials of the first and the second modes. The PSD of the each mode is itself assumed to be lognormal. In order to reduce the number of adjustable parameters, and in an effort to reduce the likelihood of multiple solutions, the present software implementation assumes that both modes have the same standard deviation. The software searches for some combination of the three adjustable parameter (two median sizes and their common standard deviation) which provides the best fit to the experimental attenuation spectra. It assumes the relative content of the modes to be known.
The corresponding PSD for these five mixed systems are shown in Figures 5 and 6. The parameters of these PSD are given in Tables 1 and 2. It is seen that in some cases this “multi-phase” approach yields approximately the correct size. For instance, the two zirconia/alumina mixtures with a lower zirconia content (mixtures 2 and 3) have almost the correct size combination. The size of the alumina particles is somewhat higher than expected (2.15 microns) but is still rather acceptable. We can say the same about the PCC/alumina mixture from Table 2. The difference of the sizes relative to the nominal values does not exceed 10%.
However, the multi-phase model appears a complete failure for the alumina/zirconia mixture 1 as well as the PCC/silica mixture. It is not clear yet why this “multi-phases model” works for some systems and not for others. We think that it might be related to the fact that the present software implementation assumes that both particle sizes modes have the same width. It is seen that the single component zirconia slurry has a PSD which is much broader (st.dev=0.43) than the PSD of the AA-2 alumina (st.dev=0.26). The bimodal searching routine finds the correct intermediate value for the standard deviation (0.3) only for mixture 2. It is interesting that this PSD solution is the closest match to the superposition of the initial PSD. The standard deviation for the other two mixtures are out of range completely and the corresponding PSD also deviate from the expected superposition.
This observation allows us to conclude that our restriction that the standard deviation be the same for both modes might itself create an artificially wrong solution. It is easy to eliminate this restriction but we are facing in this case the with multiple solution problem.
The multiple solution problem appears when the error function (difference between experimental and theoretical attenuations) has several local minimums with different combinations of the adjustable parameters. Software uses the minimum error as only one available criterion for selecting the correct combination of the adjustable parameters. In the case of the multiple minima with comparable value of the error function software may chose the wrong combination and there is no way to figure out that this particular combination is wrong.
The problem of multiple solutions is aggravated when the number of adjustable parameters exceeds some certain limit. This limit depends on the accuracy and amount of the experimental data, how adequately the real world sample is described by the model, and how accurately known are the key parameters of the colloid such as weight fraction, density, etc. There is no known algorithm to calculate the maximum allowed number of the adjustable parameters for the particular experimental technique. According to our experience with acoustics bimodal PSD with four adjustable parameters sometimes exhibits multiple solution problem. We have found ways to solve this problem in the case of single component dispersions, however the situation is more complicated for mixed dispersions with two or more chemically different components. That is why we tried to restrict the number of the adjustable parameters to only 3.
This analysis indicates that the “multi-phase” model might lead to the wrong solutions sometimes and it is unclear at this point how to completely eliminate this problem.
In contrast, the “effective media” approach circumvents this problem by addressing only the question of determining the lognormal distribution which describes but one disperse phase in an otherwise complex mixture. Since we are then dealing only with two adjustable parameters ( median size and standard deviation) the possibility for multiple solutions is most likely diminished. On the downside, when using the “effective media” approach we need to perform an additional experiment to measure the properties of this “effective media” and this may not always be possible or without other difficulties.
In the case of the PCC mixtures with the added alumina or silica, the original PCC slurry itself serves as the “effective media”. We need just three parameters to characterize this “effective media” namely: density, viscosity and attenuation. Importantly, all three parameters can be directly measured if we have access to this media. The attenuation is the most important of these three required parameters. It is also the most challenging to characterize because we need the attenuation of this media as a function of frequency from 3 to 100 MHz. The current version of the DT 1200 software allows us to define the attenuation of the effective media the same way we would normally define the “intrinsic attenuation” of even a pure liquid media. This intrinsic attenuation as measured in dB/cm/MHz can be described in terms of a polynomial function :
att(f) = att M0 + f attM1 + f2 attM2 + f3 attM3
where f is frequency in MHz, and M0, M1, M2 and M3 are the polynomial coefficients.
For example, in the simplest case we can say that our effective media is just water. Water has an attenuation which for practical purposes can be said to simply increases as a linear function of frequency if attenuation is expressed in dB/cm/MHz. Thus M0, M2, and M3 are zero and M2 represents this linear dependence.
To use the effective media approach fro mixed systems, we simply need to define new coefficients to describe the intrinsic attenuation of this new media. In the case of the alumina/zirconia mixtures we use the alumina slurry as the “effective media”. The coefficients for the alumina slurry can be calculated by doing a polynomial fit to the attenuation data as shown in Figure 7A. These coefficients are also given in Table 1. Similarly, the coefficients for the PCC “effective media” can be calculated from a polynomial fit of the attenuation data for that material as shown in Figure 7B. Likewise, these coefficients are given in Table 2
We should keep in mind that the initial alumina slurry is being diluted when we mix it with increasing amounts of the zirconia slurry. As a result, we need to recalculate the attenuation coefficients for each mixture taking into account the reduced volume fraction of the alumina in each mixture. The suitably modified values for the of attenuation coefficients of the effective media for all three alumina/zirconia slurries are also given in the Table 1. We avoided the need for making these additional calculations in the case of the PCC mixtures by simply adding dry silica or alumina powder to the PCC effective media, and therefore the coefficients for the PCC effective media is the same for both mixtures.
For an aqueous media, the software automatically calculates the intrinsic attenuation of water and subtracts this from the measured attenuation to deduce the attenuation caused solely by the presence of the disperse particles. When using the “effective media” model, the software actually works in the same way, except that the intrinsic attenuation of water is replaced by the attenuation of this new effective media. For instance, in the case of the PCC/alumina mixture the software calculates the attenuation due to the PCC contribution and subtracts it from the total attenuation of the mixture. The residual part corresponds to the attenuation due to the alumina particles and is the source of the particle size information for the alumina component. The software assumes a lognormal PSD and fits this residual attenuation using the median size and standard deviation as adjustable parameters.
This effective media approach allows us to calculate the particle size distribution of the zirconia in the alumina/zirconia mixtures and of the silica or the alumina in the case of PCC mixtures. The corresponding values are shown in Tables 1 and 2. Figures 8 and 9 illustrate the corresponding PSD for each case.
In the case of zirconia we have almost the same PSD for all three mixtures. This PSD agrees well with the initial slurry. The fitting error is much smaller than in the “multi-phase model” which is an additional indication of the consistency.
In the case of PCC mixtures the situation is more complicated. We have a very good correlation with the nominal size for the AKP-30 alumina for PCC-alumina mixture with a good fitting error.
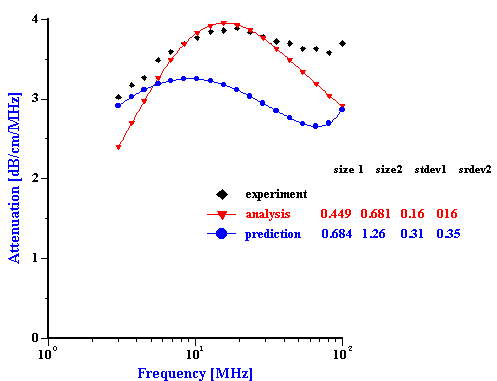
The other PCC based gives size which is twice smaller than expected. You can see from the Table 2 that the calculated size of the silica Geltech is only 0.454 microns whereas the nominal size is at least 1 micron. We measured acoustically for this silica even larger size of 1.26 microns. It might happened because of the dispersing problems. We have discovered that this silica requires a lot of efforts for being properly dispersed even at high pH and high zeta potential. For instance, we measure zeta potential of -66 mV this silica at pH 11 but it is not apparently sufficient to disperse it completely.
Summarizing results of Analysis for these 5 mixtures we can conclude that in the case of 3 mixed dispersions (alumina-zirconia mixtures 2 and 3, and PCC-alumina mixture), the both “multi-phases model” and “effective media model” give close results and reasonable PSD. For other two mixtures Analysis yields more confusing results. We suspect that failure of the “multi-phases model” for alumina-zirconia mixture 1 is related to the restriction on the PSD width, but particles aggregation is still a candidate as well. In the case of the PCC-silica mixture a double failure of the both modes certainly point towards particle aggregation.
We can test these ideas about two troubled mixtures using Prediction. This procedure allows us to test the validity of the superposition assumption which negates particles aggregation. In order to do this we must construct the total PSD using known PSD of the individual dispersions with just one dispersed phase. Then, we calculate attenuation for this PSD. This attenuation is valid for the system where there is no particles aggregation. Comparison of this theoretical attenuation with experimental data gives us an idea how much this assumption is valid. Figure 10 illustrates this theoretical and experimental attenuation spectra. In addition we place there a theoretical attenuation corresponding to the best PSD calculated using “multi-phase model” of the Analysis.
It is seen that in the case of the zirconia-alumina mixture a superposition PSD generates attenuation spectra which fits experimental spectra much better than the best Analysis PSD. Fitting error has improved from 5% to 2.3% and becomes comparable with the best fitting errors of the “effective media model”. This correlation between Prediction and Experiment proves that our suggestion about standard deviation restriction was correct. Prediction applies different std deviation to the PSD modes and as a result we achieve much better fitting than in the case of the Analysis “multi-phases model” which assumes the same standard deviation for both modes.
In addition we can conclude that there is no aggregation between alumina and zirconia particles in this mixed dispersion. Otherwise, theoretical attenuation based on the superposition assumption would not fit experimental data.
Situation with the second mixture (PCC-silica) is very different. In this case theoretical Prediction attenuation provides much worse fit than the best Analysis “multi-phases model”. Fitting error degrades from 8% to 17.2%. It means, that superposition assumption is not valid. In this case we are dealing with aggregation PCC and silica particles.
References
1. D.J. McClements, “Ultrasonic Characterization of Emulsions and Suspensions”, Adv. Colloid Interface Sci., 37, 33-72 (1991)
2. A.S.Dukhin and P.J.Goetz, P.J., “Acoustic and Electroacoustic Spectroscopy”, Langmuir, 12 [19] 4334-4344 (1996)
3. A.S.Dukhin and P.J.Goetz, P.J., “Acoustic and Electroacoustic Spectroscopy” in “Ultrasonic and Dielectric Characterization Techniques” Ed. V.Hackley and J.Texter, American Ceramic Society, 77-97, (1998).
4. Dukhin, A.S., Shilov, V.N, Ohshima, H., Goetz, P.J “Electroacoustics Phenomena in Concentrated Dispersions. New Theory and CVI Experiment”, Langmuir, July 1999
5. A.S.Dukhin and P.J.Goetz, “Acoustic Spectroscopy for Concentrated Polydisperse Colloids with High Density Contrast”, Langmuir, 12 [21] 4987-4997 (1996)
6 Shin-ichi Takeda, “Characterization of Ceramic Slurries by Ultrasonic Attenuation Spectroscopy” in “Ultrasonic and Dielectric Characterization Techniques” Ed. V.Hackley and J.Texter, American Ceramic Society, 243-257, (1998).
7. Takeda, Shin-ichi and Goetz. P.J. “Dispersion/Flocculated Size Characterization of Alumina Particles in Highly Concentrated Slurries by Ultrasound Attenuation Spectroscopy”, Colloids and Surfaces, 143, 35-39 (1998)
8. Dukhin, A.S. and Goetz, P.J “Characterization of Chemical Polishing Materials (monomodal and bimodal) by means of Acoustic Spectroscopy “, Colloids and Surfaces, accepted.
9. Wines, T.H., Dukhin A.S. and Somasundaran, P. “Acoustic spectroscopy for characterizing heptane/water/AOT reverse microemulsion”, JCIS, 216, 303-308 (1999)
10.A.S.Dukhin and P.J.Goetz, “Characterization of Aggregation Phenomena by means of Acoustic and Electroacoustic Spectroscopy”, Colloids and Surfaces, accepted, (1998)
11.A.S.Dukhin and P.J.Goetz, P.J., US Patent pending
12 .R.R.Irani and C.F.Callis, “Particle Size: Measurement, Interpretation and Application”, John Wiley & Sons, NY-London, 1971
List of Figures Titles
Figure 1. Equlibration of 3%vl zirconia slurry prepared in the KCl 10-2 with pH adjusted initially to 4. It is seen that equlibration takes about 2 hours.
Figure 2. Titration of the PCC slurry with 0.1 g/g hexametaphosphate solution.
Figure 3. Experimental attenuation spectra for initial alumina AA-2 and zirconia TZ-3YS from Sumitomo and their mixtures with weight fractions given in the Table 1. This figure illustrates reproducibiulity, including two loads for the mixture 1.
Figure 4. Experimental attenuation spectra for initial PCC slurry and its mixture with the added silica and alumina powders. Weight fractions are given in the Table 2.
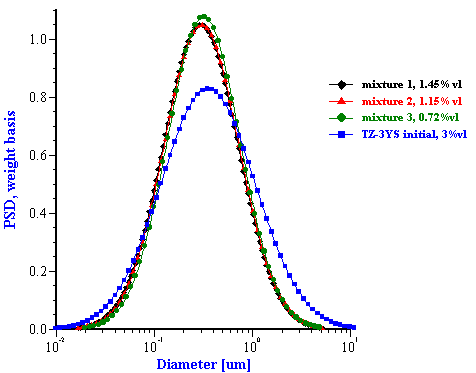
Figure 5. Particle size distributions calculated for alumina-zirconia mixtures using “multi-phases model”. The smaller size mode corresponds to zirconia, the larger size mode is alumina AA-2. Weight fraction and PSD parameters are given in the Table 1.
Figure 6. Particle size distributions calculated for PCC-alumina and PCC-silica mixtures using “multi-phases model”. Weight fraction and PSD parameters are given in the Table 2.
Figure 7. Experimental attenuation spectra measured for individual alumina AA-2 slurry and PCC slurry with polynomial fit.
Figure 8. Particle size distribution calculated using “effective media model”. In the case of zirconia the alumina AA-2 dispersion is the effective media. Attenuation of the alumina is reduced according to volume fractions from the Table 1. Density and viscosity are adjusted as effective media. In the case of alumina AKP-30 and silica the PCC dispersion as effective media.
Figure 9. Experimental and theoretical attenuation for zirconia-alumina mixture 1 and PCC-silica mixture. Theoretical attenuations are calculated for the best Analysis result and for combined PSD build from the individual distributions assuming no particle aggregation.
Table 1.
Characteristics of alumina AA-2 and zirconia TZ-3YS slurries and their mixtures.
|
Initial |
Mixture 1 |
Mixture 2 |
Mixture 3 |
|||||
|---|---|---|---|---|---|---|---|---|
|
Alumina |
Zirconia |
Alumina |
Zirconia |
Alumina |
Zirconia |
Alumina |
Zirconia |
|
|
volume fraction, % |
3 |
3 |
1.55 |
1.45 |
1.85 |
1.15 |
2.28 |
0.72 |
|
weight fraction, % |
10.96 |
15.91 |
5.5 |
7.9 |
6.6 |
6.3 |
8.2 |
4 |
|
eff. viscosity [cp] |
0.92 |
0.93 |
0.94 |
|||||
|
eff. density [g/cm3] |
1.04 |
1.05 |
1.06 |
|||||
|
att M0 |
1.593 |
1.21 |
0.982 |
0.823 |
||||
|
att M1 |
0.0845 |
0.0642 |
0.0521 |
0.0437 |
||||
|
att M2 |
-1.251 |
-0.95 |
-0.771 |
-0.646 |
||||
|
att M3 |
0.528 |
0.401 |
0.326 |
0.273 |
||||
|
Parameters of the particle size distributions, effective media approach |
||||||||
|
median lognormal [micron] |
2.15 ± 0.02 |
0.33 ± 0.006 |
0.293 ± 0.006 |
0.303 ± 0.005 |
0.317 ± 0.003 |
|||
|
st. deviation |
0.26 |
0.43 |
0.38 |
0.378 |
0.372 |
|||
|
fitting error, % |
6.6 |
1.9 |
1.4 |
1.2 |
0.95 |
|||
|
Parameters of the particle size distributions, two dispersed phases approach |
||||||||
|
median size [micron] |
0.565 ± 0.002 |
0.558 ± 0.001 |
2.922 ± 0.088 |
0.352 ± 0.005 |
3.582 ± 0.182 |
0.303 ± 0.003 |
||
|
st.deviation |
0.53 |
0.3 |
0.21 |
|||||
|
fitting error, % |
5 |
7.6 |
4.4 |
|||||
Table 2.
Characteristics of PCC slurry and its mixtures with alumina AKP-30 and silica Geltech.
|
Initial PCC |
Initial silica |
PCC and silica |
PCC and alumina |
||||||
|---|---|---|---|---|---|---|---|---|---|
|
Powder |
PCC |
Silica |
PCC |
Alumina |
|||||
|
volume fraction, % |
10.55 |
9.19 |
6.29 |
10.27 |
2.52 |
||||
|
weight fraction, % |
23.53 |
19.6 |
11.3 |
21.6 |
8.1 |
||||
|
eff. viscosity [cp] |
1.125 |
1.094 |
1.118 |
||||||
|
eff. density [g/cm3] |
1.17 |
1.13 |
1.15 |
||||||
|
att M0 |
1.053 |
||||||||
|
att M1 |
4.431 |
||||||||
|
att M2 |
-3.648 |
||||||||
|
att M3 |
0.9296 |
||||||||
|
Parameters of the particle size distributions, effective media approach |
|||||||||
|
median lognormal [micron] |
0.684 |
1.26 |
0.454 |
0.325 |
|||||
|
st. deviation |
0.31 |
0.35 |
0.015 |
0.015 |
|||||
|
fitting error, % |
1.1 |
1.3 |
7.5 |
2.4 |
|||||
|
Parameters of the particle size distributions, two dispersed phases approach |
|||||||||
|
median size [micron] |
0.449 |
0.681 |
0.798 |
0.2715 |
|||||
|
st.deviation |
0.16 |
0.19 |
|||||||
|
fitting error, % |
8 |
1.9 |
|||||||
Figure 1
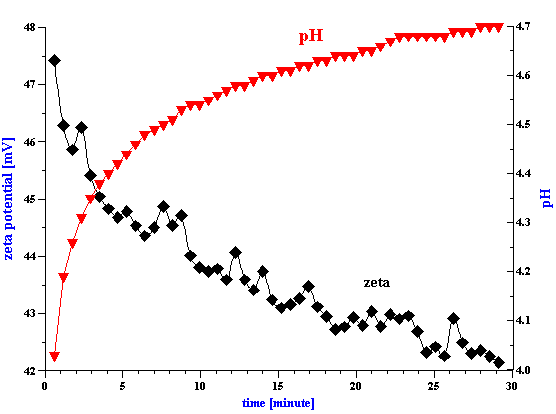
Figure 2
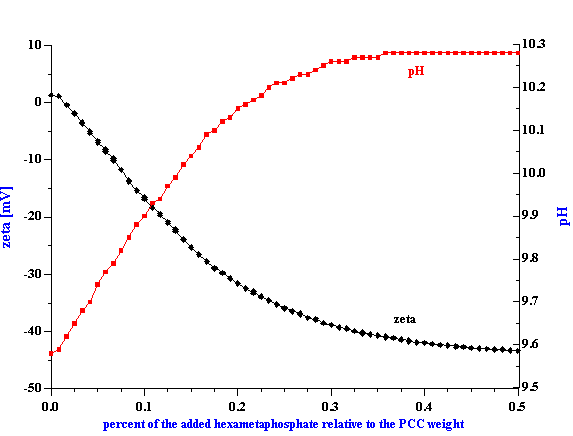
Figure 3.
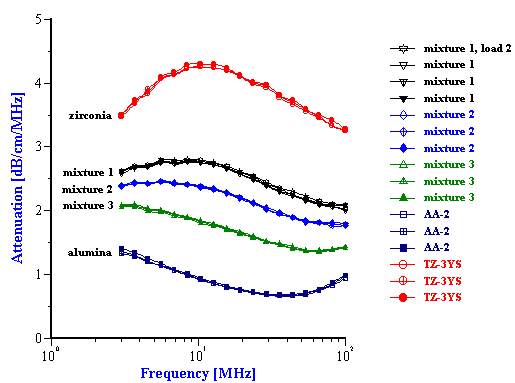
Figure 4.
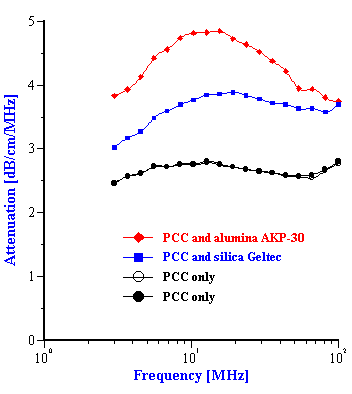
Figure 5.
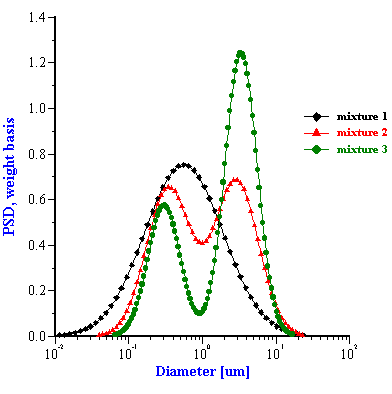
Figure 6
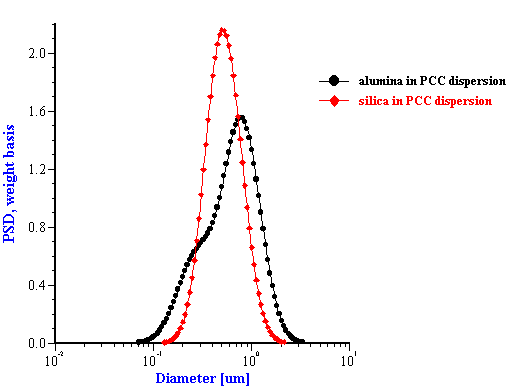
Figure 7
Alumina AA-2
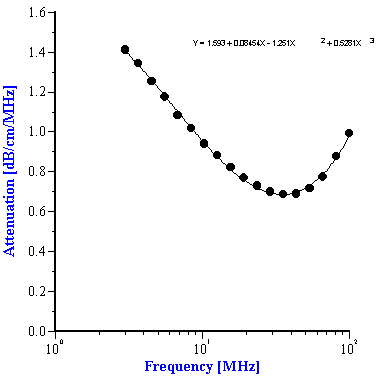
PCC slurry
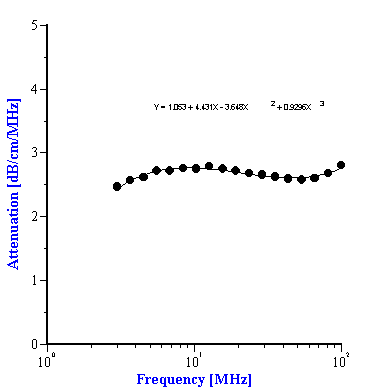
Figure 8.
Zirconia
Alumina and silica in PCC slurry
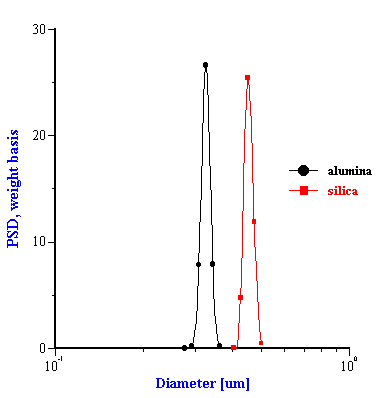
Figure 9.
Zirconia-alumina mixture 1
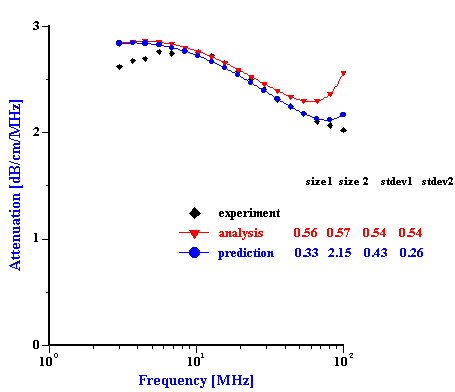
PCC- silica Geltech mixture