Electroacoustics for Concentrated Dispersions
A.S.Dukhin1, H.Ohshima2, V.N.Shilov3, P.J.Goetz1
1Disperion Technolgy Inc., 3 Hillside Avenue, Mount Kisco, NY 10549, USA
2Faculty of Pharmaceutical Sciences and Institute of Colloid and Interface Science, Science University of Tokyo, 12 Ichigaya Funagawara-machi, Shnjuku-ku, Tokyo 162-0826, Japan
3Institute of Biocolloid Chemistry, Academy of Sciences of the Ukraine, Kiev, Ukraine
Introduction
Electroacoustics opens in principle an opportunity to characterize concentrated dispersed systems where particle interaction is significant. In order to turn this opportunity into reality a theory is required. This theory must connect the measured electroacoustic parameters such as Colloid Vibration Current (CVI) [1] or Electrosonic Amplitude (ESA) [2] with properties of the given dispersed system including zeta potential and particle size. Absence of this theory is a major obstacle for further development of electroacoustic based techniques.
The first versions of an electroacoustic theory were created by Enderby and Booth [3,4], but only for dilute systems. Later O’Brien made an important step [5] introducing the dynamic electrophoretic mobility m d and deriving a general expression for this parameter which is valid in concentrated systems:
![]() (1)
(1)
where C is a cell constant, s is the density contrast, j is the volume fraction of solid, P is the hydrodynamic pressure, and E is the external electric field strength.
Dynamic electrophoretic mobility can be used as a useful system characteristic. It is sufficient for instance, for determining the isoelectric point. However, the dynamic electrophoretic mobility provides only a partial characterization. The zeta potential and the particle size distribution are required for more complete characterization.
There are several theories describing the relationship between dynamic mobility and other properties of the dispersed system. The most widely known and tested theory created by O’Brien [5] is valid only for the dilute case with a volume fraction below 2% and only for a thin double layer [6]. Another theory created by Babchin et. al. [7,8] removes the restriction of the thin double layer but still does not take into account particle-particle interaction and consequently is applicable still only for dilute systems.
The first attempt to derive an electroacoustic theory for concentrated systems was made by Marlow [ 1 ] using a cell model.
Rider and O’Brien [ 9 ] used a completely different approach for deriving an expression for the dynamic mobility of a single pair of colloid particles. This work showed that such an approach has many large mathematical complications. Nevertheless, O’Brien chose this approach because he concluded that the cell model approach did not work since he was unable to fit theories based on such cell models to experimental data. He published this conclusion [10] without giving any explanations to this surprising fact. There is only one detail about this unpublished theory mentioned in the paper [10] that Levine-Neale cell model [11] is used.
Despite the negative conclusions reached by O’Brien, several new papers have recently appeared which again address the cell model approach. A new cell model based theory was created by Ohshima [12 ] initially using just the Levine-Neale cell model and later modified by Ohshima and Dukhin [13] using Onsager relationships. Another cell model version of the theory was developed by Shilov, Borkovskaya and Dukhin [14] using the Shilov-Zharkikh cell model [15]. We show in this paper that the both theories yield the same result.
Importantly, the final versions of these new theories predict a much stronger volume fraction dependence than initial Levine-Neale cell model [12], which perhaps explains why the initial unpublished O’Brien’s theory failed to fit experiments.
However, there is an additional reason for the initial failure of the cell model approach. It is related to the problem of the frame of reference. The cell model enables us to calculate the electrophoretic mobility relative to a liquid frame of reference. However, it is not clear that this frame of reference is appropriate for comparison of the theory with experiment. Two possibilities have been suggested before: a zero momentum frame of reference, or a zero velocity frame of reference.
O’Brien and Rider suggested that electrophoretic mobility must be determined in a frame of zero momentum flow [ 9 ].
On the other hand, Zukoski and Saville [ 16 ] and Chen and Keh [ 17 ] have defined electrophoretic mobility using a zero volume flow frame of reference.
For dilute systems the question of the frame of reference becomes unimportant since they each provide the same result. For concentrated systems, the frame of reference becomes increasingly important. We think that the question as to which frame of reference is most appropriate is still open. For this reason we evaluate both versions in this paper.
Our new theory has been tested using a concentrated rutile dispersion. The initial concentrated dispersion was diluted with supernate in order to maintain the same chemical composition for all volume fractions. As a result, we would expect that the actual zeta potential would be essentially constant, at least up to perhaps 35 %vol where we might expect some decrease due to double layer overlap. A correct theory should enable us to calculate a zeta potential which remains constant over a wide concentration range.
However, dilution can change particle size as well, and this would correspondingly affect the zeta potential calculation. For this reason our equilibrium dilution test must also include an independent monitoring of the particle size. This is not trivial because the particle size measurement must be done in concentrated system. We know of only one reliable method to accomplish this goal: acoustic spectroscopy [18-20, 27-29]. We used this method for calculating particle size from the measured attenuation spectra.
Acoustic spectroscopy also provides an additional consistency check using sound speed. We showed that the experimentally measured sound speed correlates within 1% with the sound speed calculated for corresponding particle size using existing theory [18].
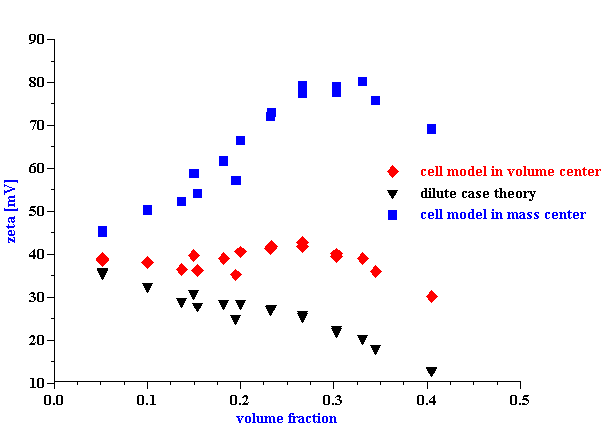
This equilibrium dilution test made it clear that a zero volume flow frame of reference yielded more constant values of zeta potential with volume fraction, than a zero momentum frame of reference. Zero volume flow reference provided almost constant zeta potential for volume fractions up to 35%vol with variations of just 2 mV. In contrast, the zeta potential calculated following O’Brien using the zero momentum frame of momentum increased more than two times.
Theory
![]() (2)
(2)
where: a =aÖ w /n , b =ba /a, n is kinematic viscosity, w is frequency.
![]()
![]()
![]()
![]()
![]()
![]()
![]()
It is important to mention that the Colloid Vibration Current defined by expression (2) is a local current. In the real experiment the macroscopic current is a measured parameter. The relationship between this local and macroscopic CVI requires an additional consideration of the frame of reference.
Dynamic mobility in different frames of references.
The expression for the dynamic mobility derived by either of these theories [12-14] is valid in the frame of reference connected to the liquid. In order to compare this theory with experiment, the electrophoretic mobility must be recalculated either in the frame of zero momentum or in the frame of zero volume flow. In order to make an appropriate transition let us consider particle motion in a new, as yet unspecified, frame of reference (see Figure 1) under the influence of external electric field E.
Particles move relative to this reference frame with a velocity Up . The velocity of the liquid motion is Um . The dynamic electrophoretic mobility specified by the cell model theory m dc is a part of the following relationship between the velocity of the particle and the velocity of liquid:
![]() (3)
(3)
The experimentally measured electrophoretic mobility is defined with the following expression:
![]() (4)
(4)
The last equation must specify the nature of the frame of reference.
If we employ the zero volume flow assumption, these two velocities are related by following expression:
![]() (5)
(5)
Alternatively, if we employ the zero momentum flow assumption, we obtain a quite different relationship between velocity of the particle and the liquid:
![]() (6)
(6)
where r m and r p are densities of the medium and of the particle.
The system of equations (3-6) yields the following expression for the dynamic electrophoretic mobility in the zero volume flow frame of references:
![]() (7)
(7)
On the other hand, the dynamic mobility calculated in the zero momentum frame is quite different:
![]() (8)
(8)
where r s is the density of the dispersion.
This final expression differs from the expression for the dynamic electrophoretic mobility in the frame of the momentum derived by O’Brien and Rider [ 9 ]. The difference arises because O’Brien and Rider used m d with a different meaning. They derived the relationship between electrophoretic mobilities in the momentum frame and the frame of the zero volume flow at low frequency. Expression (8) relates dynamic mobilities in the momentum frame and the frame of the liquid.
It is important to add that this analysis has been performed for the one dimensional case. We neglected effects related to the shunt volume flow at the edges of the sound pulse. The width of the sound beam must be much larger than the wavelength corresponding to the frequency of measurement. This condition is certainly valid for DT-1200 which measures CVI at 3 MHz.
Experimental Technique
We use combined Acoustic and Electroacoustic Spectrometer DT-1200 developed by Dispersion Technology, Inc. [ 23 ]. See DT Homepage www.dispersion.com
Experimental Protocol
The experiment was performed using rutile R-900 produced by E. I. DuPont de Nemouirs. The particle size of this rutile calculated from the attenuation spectra (Figure 3) is shown on Figure 4. This rutile is alumina covered. As a result, its dispersion is stable at low pH.
We prepared 1 liter of the 20%vl rutile dispersion in 10-2 mol/l KCL. It was necessary to adjust pH several times during the dispergation and sonication. The final dispersion at pH 4 was sonicated for 5 minutes. The dispersion was aged for two days to allow equilibration and separation. There were four fractions after this equilibration. The top layer was almost pure supernate, the next layer had an average concentration of 20%vl, the third layer with a concentration of about 40%vl and finally a cake on the bottom. The final pH was about 4.3.
Three first fractions were used as the basis for the equilibrium dilution. The dilution was made in two steps. First, the 20%vl fraction was diluted in steps down to roughly 5%vl. Next, the more concentrated 40%vl fraction was diluted in steps down to roughly 12%vl. This procedure gave some overlap between dilution series and allowed us to test the reproducibility. Dilution steps were made almost randomly to avoid any systematic effects, the concentration in each case checked with a pyncnometer. The accuracy of the pyncnometer deteriorates at low solid content, and therefore we did not go below 5%vl.
The following seven experimental parameters were measured at each dilution step: attenuation spectra, sound speed, phase and magnitude of CVI, pH and temperature.
Results and Discussion
There were no significant variations of the pH of the sample with volume fraction, which supports the equilibrium nature of the dilution protocol.
The measured attenuation spectra are shown in Figure 5. The corresponding median particle size is shown in Figure 6. It is seen that the size increases slightly with volume fraction. This increase can be caused by sedimentation during the equilibration period. The more concentrated 40%vl fraction might be more enriched with larger particles.
It is important to mention that acoustic theory used to calculate particle size [ 18 ] does take into account volume fraction effects. Otherwise, particle size given by acoustics might be wrong which causes error in zeta potential. According to our experience neglecting particle-particle interaction causes about 300% error in calculating particle size for dispersed system with 40% volume fraction.
The sound speed measurement provides an additional consistency check. Figure 7 shows the experimental and theoretical sound speed at 10 MHz. The theoretical sound speed is calculated using acoustic theory from paper [ 18 ]. This calculation requires particle size distribution. The attenuation measurement provides these data. It is seen that experiment phase sound speed and theoretical sound speed are very close. The difference between them is less than 1% for almost all volume fractions. This consistency test confirms the calculated value of the median particle size.
We would like to emphasize that it is the first experimental test of the theory determining sound speed with taking into account particle particle interaction [18]. Usually, so-called Wood sound speed or scattering ECAH theory is used for characterization of sound speed in dispersions [27-29]. The Wood sound speed corresponds to the low frequency limit. There is a more recent sound speed theory developed in papers [ 25, 26 ]. However, there is only one theory which gives relationship between particle size and sound speed [18] for concentrated dispersions. It is seen that particle size contribution is quite important. There is a substantial difference between Wood speed and theoretical sound speed.
Sound speed is an essential part of the CVI phase calculation. Figure 8 shows experimentally measured phase and phase corrected for sound speed. This correction has been made with experimental phase sound speed recalculated to the 1.5 MHz using theory from the paper [18]. It is seen that corrected CVI phase is volume fraction independent. It is supposed to be 3600 which corresponds to particles with positive zeta potential.
The absolute value of the zeta potential is shown in Figure 9. It is calculated from CVI at 3 MHz using the cell model theory developed in this paper. The calculation has been made using the particle size shown on Figure 6 and the attenuation from Figure 5. The attenuation correction is required because sound attenuates traveling from transducer to the electroacoustic antenna.
It is clear that the zeta potential remains independent on the volume fraction up to approximately 30%vl using the zero volume flow frame of reference. For comparison, the zeta potential drops to a level of only 10 mV at 35%vl when calculated with the dilute case O’Brien theory. Furthermore, the zeta potential actually increases more than 2 times at 30%vl if O’Brien suggestion of the zero momentum frame of reference is adopted.
We would like to stress at the end that all acoustic and electroacoustic measurements and calculations are consistent and mutually confirming. This experiment has been intentionally designed as overdefined. The amount of experimental information exceeded requirements for calculating particle size and zeta potential. As a result we had additional information (sound speed and CVI phase) for consistency tests which makes this experimental test of the developed theory even more meaningful.
We would like to add that there are several sources of the volume fraction dependence of the electroacoustic signal. In this paper we addressed so far only one aspect related to the theory of CVI. Other aspects are related to the measurement procedure. Interpretation software of the DT-1200 takes into account two of them.
The first effect is a partial reflection of ultrasound on the surface of the transducer which is facing the dispersed system. This reflection reduces intensity of the ultrasound which generates CVI by factor:
![]() (15)
(15)
where It and Ii are sound intensity transmitted to the dispersion and intensity generated by the pieso crystall, Zt and Zs are acoustic impedances of the transducer and dispersion.
This reflection effect depends on the volume fraction of the dispersed system because of the acoustic impedance Zs. Real part of this acoustic impedance equals:
![]() (16)
(16)
where r s and cs are density and sound speed of the system. These parameters are volume fraction dependent.
The second factor which is built into the DT-1200 software is attenuation of the ultrasound. There is a gap between transducer and CVI antenna. Sound pulse attenuates propagating through this gap. As a result intensity of the sound which generates CVI (Icvi ) decays by the factor:
![]() (17)
(17)
where a is attenuation coefficient in dB/cm/MHz, L is a gap width between transducer and antenna, f is frequency in MHz.
Attenuation is frequency dependent parameter in this relationship.
These two additional factors make relationship between CVI and zeta potential more complicated. We should admit that there might be some additional factors which are missed in the DT-1200 software. Unfortunately uncertainties with theory do not allow us to test this measurement procedure completely. All these question can be resolved only after all theoretical issues about CVI (ESA) would be clarified.
Conclusions
It is shown that combined acoustic and electroacoustic spectroscopy provide self-consistent and complete characterization of particle size distribution and zeta potential in concentrated dispersed systems with volume fraction up to 40%. The first step of this characterization is the measurement of the attenuation frequency spectra, sound speed and Colloid Vibration Current. This set of parameters can be measured reliably and reproducible in any concentrated liquid based dispersed system. This set of parameters contains sufficient information for calculating particle size and zeta potential when real system can be modeled as a collection of separate particles in liquid.
Second step of characterization procedure is the calculation of PSD and zeta potential using appropriate theoretical models. The cell model concept provides means for developing acoustic [18] and electroacoustic [12-14] theories which are valid in concentrated systems. Equilibrium dilution test confirms the validity of these theories.
The attenuation frequency spectra is the data source for calculating PSD independently of any electrical properties of the dispersion.
CVI is a data source for calculating the zeta potential.
There are several links between acoustics and electroacoustics. For instance, acoustics provides information about sound speed which is necessary for calculating correct phase of CVI. Acoustics gives also particle size data which is important for calculating the absolute value of zeta potential.
Combination of acoustics and electroacoustics yields extra information which can be used for testing basis assumption about system stability. Sound speed is the source of this information. Sound speed is very sensitive to the structural effects. Deviation between theoretical and measured sound speed is an indication that real system cannot be replaced with realistic collection of independent particles in liquid.
Bibliography
1.Marlow,B.J., Fairhurst,D. and Pendse,H.P., “Colloid Vibration Potential and the Electrokinetic Characterization of Concentrated Colloids”, Langmuir, 4,3, 611-626 (1983)
2. Cannon D.W. “New developments in electroacoustic method and instrumentation”, in S.B.Malghan (Ed.) Electroacoustics for Characterization of Particulates and Suspensions, NIST, 40-66 (1993)
3.Enderby, J.A. “On Electrical Effects Due to Sound Waves in Colloidal Suspensions”, Proc.Roy.Soc., London, A207, 329-342 (1951)
4.Booth, F. and Enderby, J. “On Electrical Effects due to Sound Waves in Colloidal Suspensions”, Proc. of Amer.Phys.Soc., 208A, 32 (1952)
5.O’Brien, R.W. “Electro-acoustic Effects in a dilute Suspension of Spherical Particles”, J.Fluid Mech., 190, 71-86 (1988)
6. Hunter, R.J. “Review. Recent developments in the electroacoustic characterization of colloidal suspensions and emulsions”, Colloids and Surfaces, 141, 37-65 (1998)
7.Babchin, A.J., Chow, R.S. and Sawatzky, R.P. “Electrokinetic measurements by electroacoustic methods”, Adv.Colloid Interface Sci., 30, 111 (1989)
8. Sawatzky R.P. and Babchin, A.J. “Hydrodynamics of electrophoretic motion in an alternating electric field”, J.Fluid.Mech., 246, 321-334 (1993)
9.Rider,P.F. and O’Brien,R.W., “The Dynamic Mobility of Particles in a Non-Dilute Suspension”, J.Fluid.Mech., 257, 607-636 (1993)
10. O’Brien R.W., Rowlands W.N. and Hunter R.J. “Determining charge and size with the Acoustosizer”, in S.B.Malghan (Ed.) Electroacoustics for Characterization of Particulates and Suspensions, NIST, 1-21 (1993)
11.Levine, S. and Neale, G.H. “The Prediction of Electrokinetic Phenomena within Multiparticle Systems.1.Electrophoresis and Electroosmosis.”, J. of Colloid and Interface Sci., 47, 520-532 (1974)
12.Ohshima, H. “Dynamic Electrophoretic Mobility of Spherical Colloidal Particles in Concentrated Suspensions”, J. of Colloid and Interface Sci., 195, 137-148 (1997)
13.Ohshima, H. and Dukhin, A.S. “Colloid Vibration Potential of Concentrated Suspension of Sperical Colloidal Particles”, JCIS, submitted
14. Dukhin, A. S., Shilov, V.N. and Borkovskaya Yu. “Dynamic Electrophoretic Mobility in Concentrated Dispersed Systems. Cell Model.”, Langmuir, submitted
15.Shilov, V.N., Zharkih, N.I. and Borkovskaya, Yu.B. “Theory of Nonequilibrium Electrosurface Phenomena in Concentrated Disperse System.1.Application of Nonequilibrium Thermodynamics to Cell Model.”, Colloid J., 43,3, 434-438 (1981)
16.Zukoski, C.F. and Saville, D.A. J.Colloid and Interface Science, 115 (2), 422 (1987)
17.Chen, S.B. and Keh, H.J. “Electrophoresis in a dilute suspension of colloidal particles”, AIChE J., 34, 1075 (1988)
18. A.S.Dukhin and P.J.Goetz, “Acoustic Spectroscopy for Concentrated Polydisperse Colloids with High Density Contrast”, Langmuir, 12 [21] 4987-4997 (1996)
19.A.S.Dukhin and P.J.Goetz, P.J., “Acoustic and Electroacoustic Spectroscopy”, Langmuir, 12 [19] 4334-4344 (1996)
20. 15.A.S.Dukhin and P.J.Goetz, “Characterization of Aggregation Phenomena by means of Acoustic and Electroacoustic Spectroscopy”, Colloids and Surfaces, accepted
21. Lyklema, J. “Fundamentals of Interface and Colloid Science”, Volumes 1, Academic Press, 1993
22. Ohshima, H. “Electrical Phenomena at Interfaces, 2nd Edition” (Ohshima, H. and Furusava, K. Eds.) Marcel Dekker, NY, 1998
23.A.S.Dukhin and P.J.Goetz, P.J., US Patent pending
24.R.R.Irani and C.F.Callis, “Particle Size: Measurement, Interpretation and Application”, John Wiley & Sons, NY-London, 1971
25.Temkin, S. “Sound Speed in Suspensions in Thermodynamic Equilibrium” Phys.Fluids, vol. 4, 11, pp.2399-2409, November 1992
26.Temkin, S. “Sound Propagation in Dilute Suspensions of Rigid Particles” The Journal of the Acoustical Society of America, vol. 103, 2, pp.838-849, February 1998
27.McClements, J.D. “Ultrasonic Determination of Depletion Flocculation in Oil-in-Water Emulsions Containing a Non-Ionic Surfactant”, Colloids and Surfaces, 90, 25-35 (1994)
28.McClements, D.J. “Ultrasonic Characterization of Emulsions and Suspensions”, Adv. in Colloid and Interface Sci., 37 (1991) 33-72
29. Holmes, A.K., Challis, R.E. and Wedlock, D.J. “A Wide-Bandwidth Ultrasonic Study of Suspensions: The Variation of Velocity and Attenuation with Particle Size”, J.Colloid and Interface Sci., 168, 339-348 (1994)
Figure 1. Scheme illustrating generation of ESA signal and showing relationship between different velocities in laboratory frame of references.
E
Up
Um
Us
laboratory frame of references
Figure 2. Titration of 10%wt silica Ludox and 20%wt chemical polishing silica ECC.
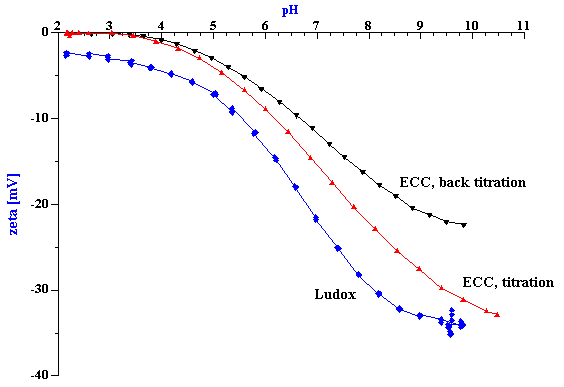
Figure 3. Attenuation spectra of the stable rutile R-900 at 5%vl
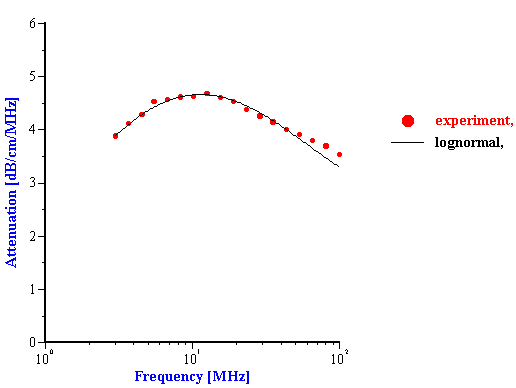
Figure 4. Particle size distribution corresponding to theoretical lognormal attenuation on Figure 3.
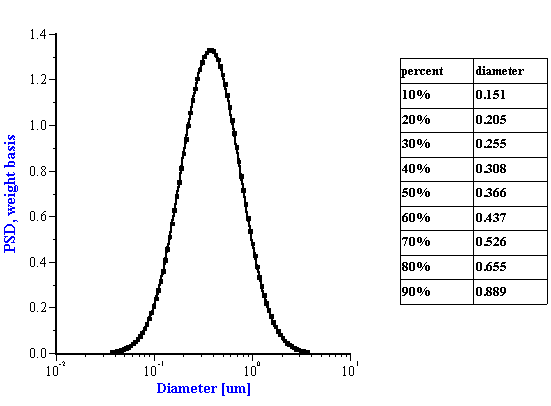
Figure 5
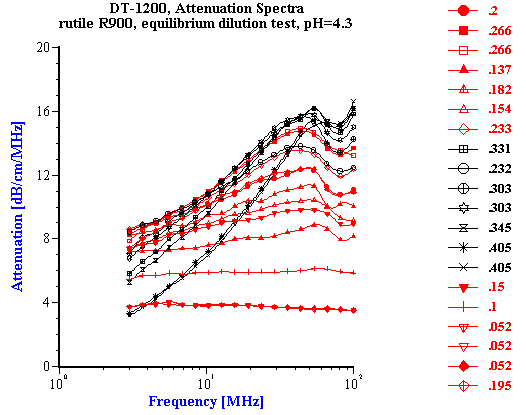
Figure 6. Median particle size versus volume fraction for rutile R-900 after equilibrium dilution
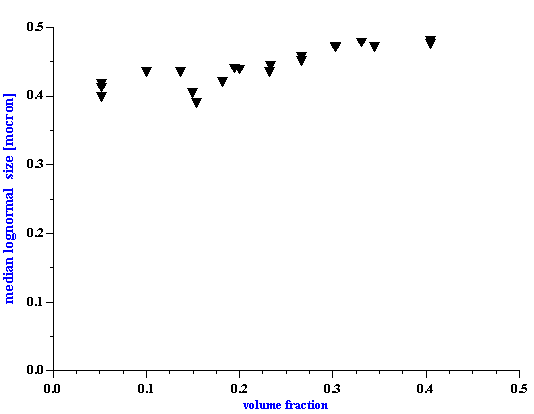
Figure 7. Experimental and theoretical sound speed of rutile R-900 after equilibrium dilution.
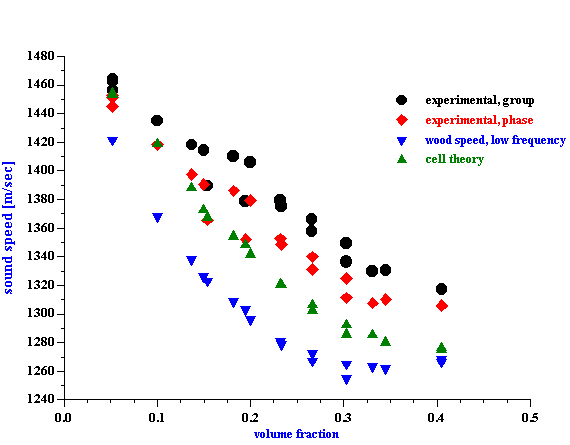
Figure 8. Experimental CVI phase and corrected CVI phase of rutile R-900 after equilibrium dilution.
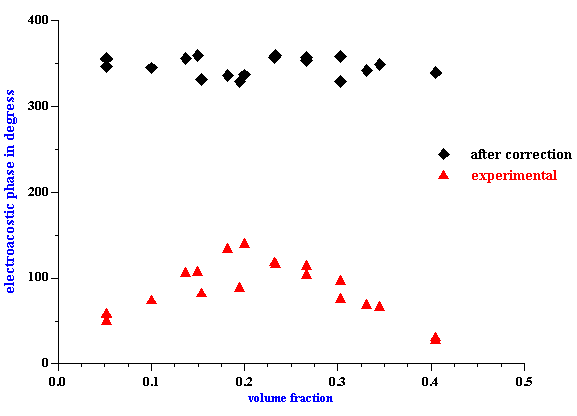
Figure 9. z -potential of rutile R-900 after equilibrium dilution calculated using developed cell model theory
