Ionic properties of so-called “non-ionic” surfactants in non-polar liquids
A.S.Dukhin and P.J.Goetz
Dispersion Technology Inc., Bedford Hills, NY, USA
Abstract
Conductivity measurements of various “non-ionic” SPAN surfactants dissolved in several non-polar liquids reveal that they are actually somewhat ionic in such low-conducting media. They produce substantial number of ions, either due to dissociation or by stabilizing ions existing in liquid as ion pairs. Exact mechanism remains unknown.
The apparent dissociation constant correlates with the HLB number; the larger the HLB value, the larger the conductivity. There is no clear correlation with dielectric permittivity of liquid.
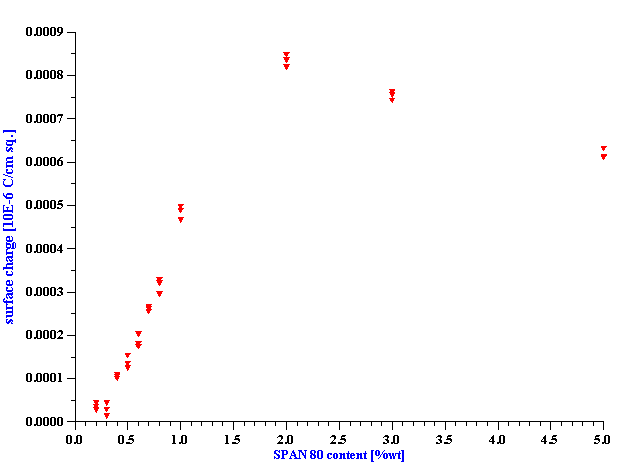
Conductivity and electroacoustic measurements of 5%vl dispersion of alumina AKP-30 in such SPAN 80 – kerosene solutions reveals that the adsorption of SPAN molecules on the alumina surface substantially reduces the degree of SPAN 80 apparent dissociation. Cation adsorption determines the positive surface charge, with a value that depends on the SPAN 80 content, reaching saturation at about 0.0007 micro-coulomb per cm2 at 1%wt SPAN 80.
Analysis of the conductivity and electroacoustic data allows us to calculate the diffusion coefficient of SPAN 80 anions in kerosene, approximately 10-7 cm2 /sec. The diameter of the micelle that is protecting SPAN 80 ions is about 30 nm, which is about equal to the critical Bjerrum diameter. The computed apparent dissociation constant of SPAN 80 in kerosene is 2.4 10-11, which is very close to the value for weak electrolytes in water.
This phenomena offers means for controlling ion composition in low-conducting non-polar liquids, creating a model system for verifying various electrochemical, electrokinetic, electroacoustic theories in these liquids.
Introduction
This paper might be of interest for people specialized in the following fields:
Properties of surfactants solutions
Electrochemistry of non-polar liquids
Electrokinetics in non-polar liquids
Electroacoustics in low-conducting media
Electrochemistry of low-conducting non-polar liquids still presents many challenges. Two reviews [1, 2] present numerous theoretical predictions and considerable experimental data, but still leave many questions unanswered. The first review is by Kitahara in 1984, the second more extensive review is by Morrison in 1993. There are several common points in these reviews, which we follow in this work, with some modification according to more recent theory and experimental techniques.
We concentrate our attention on the “equilibrium” aspect of electrochemistry in non-aqueous liquids. Equilibrium electrochemistry deals with the chemical nature, origin and interactions of the electric charge carriers in the solutions. In contrast, non-equilibrium electrochemistry considers effects that occur, for example, when the system is perturbed by an electrical current passing through the system. We try to use so-called non-invasive experimental techniques that cause just small deviations from this equilibrium condition.
Reading these two reviews one might conclude that there is some consensus regarding the size of ions in low conducting liquids based on application of the Bjerrum theory [3]. This theory simply compares the attractive energy of the cation-anion interaction E with the energy of thermal motion kT, where k is Boltzman constant, and T is absolute temperature. This theory predicts that ions might exist separately only if their size aion exceeds a certain value, the so-called Bjerrum radius aB. Otherwise they would build cation-anion pairs because the thermal motion would not be able to prevent their aggregation at small distances. This condition can be formulated as the following non-equality:
![]() (1)
(1)
where e 0 and e are the dielectric permittivities of vacuum and liquid respectively and e is the electron charge.
Simple calculations led Morrison to the conclusion that the diameter of the ions must be larger than 28 nm in order for them to exist in low-conducting media.
According to Kitahara this condition could be satisfied in two ways:
soluble molecules that dissociate into large ions;
dissociation with further solubilization of the simple small ions in larger micelles.
Both reviews present considerable data concerning the mechanism of micelle formation around the ions.
It is clear that solubilization should depend on the polarity of the initial molecules that built an outer shell around ions. More polar molecules would provide better shielding for ions, creating stronger and larger micelles. This suggests the idea that ionization in low conducting media could be related to the HLB number (hydrophobic-lyophilic balance). The larger this HLB number, the more polar molecules of the surfactant. This means that we might expect a direct correlation between ionization and HLB number for various substances that are soluble in low conducting liquids.
To verify this hypothesis we used several non-ionic surfactants from the SPAN family, with HLB numbers that varied from 1.8 to 8.6. There are two extensive reviews describing the properties of such non-ionic surfactants [4, 5], but neither mentions that they could induce electric conductivity in low dielectric liquids. Yet, we discovered that they do induce electrical conductivity, which means that the so-called “non-ionic” surfactants in the SPAN family are actually “ionic”. They produce a substantial number of ions and allow one to control the ionic strength and conductivity with high precision.
There are two hypotheses regarding the origin of these ions. First of all, it is possible that SPAN molecules dissociate. Their ions might be larger that Bjerrum radius, which would allows them to exist in non-polar liquid.
The other hypothesis relates this phenomenon to the “ion pairs” that always exist in non-polar liquids due to the small contaminations. They consist of simple ions with small sizes. Electrostatic attraction pulls these cations and anions together creating so-called ion pairs. These entities exist in dynamic balance between electrostatic attraction and destructive thermal motion. Surfactant molecules could interfere with this balance. They could build protective shells around ions, which effectively enlarge size of the ions and prevents their aggregation in pairs.
It is not clear yet what mechanism is responsible for observed ionization. We would use term dissociation in effective meaning, keeping in mind the second possibility of ions origin.
The Kitahara and Morrison reviews noted the use of conductivity measurements as a direct measure of the ionization of ionic surfactants such as AOL. We followed the same logic to characterize the ionic properties of our so-called non-ionic SPAN surfactants. We will show that conductivity of various SPAN solutions indeed correlates with HLB number and increases linearly with concentration of the surfactant.
Although conductivity measurement can confirm ionization, by itself it does not yield sufficient information for characterizing the size of the resultant ions or the apparent dissociation constant. To get more detailed information we again follow the Kitahara and Morrison reviews, both of which combine data for homogeneous and heterogeneous systems. Addition of insoluble dispersed particles to the low-conducting liquid allows one to separate ions between the bulk fluid and the particle surface. This can then be used as a source of addition information for further analysis.
Following this logic, we prepared dispersions of alumina in the same SPAN solutions. We characterized these dispersions using two techniques: conductivity and electroacoustics.
Electroacoustics was only briefly mentioned by Morrison [2], as it became commercially available at just about that time. Actually, it only recently became a useful tool for characterization of the low-conducting dispersions with the creation of a new electroacoustic theory that takes into account overlap of double layers. The electroacoustic method works with concentrated dispersions with volume fraction usually above 1%. This is a big advantage over traditional electrophoretic techniques. However, in the case of low-conducting liquids it presents a problem of dealing with overlapped double layers (DL). This overlap occurs due to the much larger DL thickness compared to aqueous systems. This problem has been resolved only recently when Shilov and colleagues created an appropriate electroacoustic theory [6]. Appendix 1 gives a short overview of this theory.
There is one more advantage of electroacoustics over traditional methods; it can be made practically non-invasive by using ultrasound for generating an electric response, the so-called Colloid Vibration Current (CVI). It is important to mention that the other mode of electroacoustic measurement, the so-called ESA effect, in which an electric field is the driving force, might create a large disturbance in the system and result in a non-equilibrium measurement. Morrison in his review expressed particular concerns that the high electric field applied to study low-conducting liquids could cause artifacts. For instance he wrote about electrodeposition method: “…One wonders whether the electrodeposition might be measuring some electrode reaction, possibly at high field if particles come close to electrode, rather than some equilibrium charge distributions…”. Same concerns could be valid regarding ESA mode of electroacoustics because electric field is a primary driving force. The CVI mode of electroacoustics is free of these concerns because electric effects are secondary, electric current and electric field are too weak to produce any real disturbance of the equilibrium distributions.
The Electroacoustic method yields information about electric surface charge. Combining this data with conductivity results allows us to estimate size of the ions, their concentration, apparent dissociation constant, diffusion constant, and the size of the protective micelle. These parameters were not available before.
Materials and methods
We use following surfactants:
sorbitan monolaurate, SPAN 20 by Aldrich, HLB=8.6, MW [g/mol]=346
sorbitan monolaurate, SPAN 20 by Spectrum Chemical Co., HLB=8.6, MW [g/mol]=346
sorbitan mono-oleate, SPAN 80, by Fluka, HLB=4.3, MW [g/mol]=428
sorbitan sesquioleate, Arlacel 83, by Aldrich, HLB=3.7, MW [g/mol]=560
sorbitan triolate, SPAN 85 by Fluka, HLB=1.8, MW [g/mol]=956.
We use several liquids:
hexadecane 99% pure by Sigma
butyl acetate 99% pure by Aldrich.
heptane 99%pure by Aldrich
hexane by Engelhard
toluene 99%pure by Fisher Scientific
kerosene, from hardware store
We tried several different producers of kerosene and discovered practically no influence of the kerosene origin on the results of measurements.
For dielectric permittivities of these liquids shown in the legend on Figure 4 we used reference [11], but for kerosene. We use approximately 2 for dielectric constant of kerosene because it is not clear how impurities would affect this number.
We used alumina AKP-30 by Sumitomo as the dispersed phase. We prepared 5% vl dispersions by adding the powder to the various kerosene-surfactant solutions and then ultrasonically dispersing them for two minutes.
The primary particle size of the alumina is 0.3 microns, according to Sumitomo and others [7]. We measured the particle size in the kerosene dispersions using the DT-1200 by Dispersion Technology. The acoustic sensor of this instrument allows us to characterize particle size without dilution (for detail description see [8]). This sample required continuous mixing of the alumina dispersion to prevent settling, which was provided by the built-in magnetic stir bar in the DT-1200 sample chamber.
For conductivity measurements we used a Model 627 Conductivity Meter by Scientifica. It operates at 18 Hz with an applied voltage of about 5 V rms. The measurement range is from 20 to 20000 picosiemens/cm.
For electroacoustic measurement we used the Zeta Potential Probe DT-300 (for detail description see [7]). This probe could be inserted directly into the sample vessel, as it is shown in Figure 1. An external magnetic mixer prevents settling of particles.
We also used microelectrophoretic instrument, PenKem Laser ZeeMeter Model 501, for verifying the sign of the particle’s electric charge. Electroacoustics determines the sign of the surface charge through the phase of the measured CVI signal. In non-aqueous systems we might expect some variation in the CVI phase compared to traditional water based dispersions. For instance, Shilov’s theory [6] predicts that phase of CVI in the dispersion with overlapped DLs varies in the range from 0 to 900 , whereas in aqueous system it changes from 0 to 450 [9]. This uncertainty in the expected CVI phase suggested that we use some independent confirmation of the sign of the particles electric charge, which we accomplished by observing the direction of motion of the charged particles in a known electric field.
Conductivity measurement of the homogeneous liquid solutions
Figure 2 shows the conductivity of the kerosene samples with various concentrations of different “non-ionic” surfactants. The reproducibility of these measurements is about 1%, probably limited by the precision with which we added the surfactant.
There is clearly large difference between different surfactants. We plotted the same data on logarithmic scale on Figure 3 to make this more visible.
In order to rule out the possibility of impurities in surfactant as a factor responsible for this conductivity, we tested two different suppliers of the SPAN 20. The conductivity curves are practically identical, which proves that the observed effect is related to the chemistry of the surfactant molecule.
The differences in the conductivity curves correlate with the HLB numbers of the corresponding surfactants: the higher HLB, the larger the conductivity. This agrees well with the micelle model of ionic conductivity induced by the surfactants. The higher HLB number reflects more polarity of the corresponding surfactant. Consequently, the protective micelle shell around the ion must be stronger and, perhaps, even more extended. Statistically this would lead to a larger number of ions and a higher conductivity.
However, the HLB number is not the only factor. We tested a surfactant from a different family for verifying the importance of other details in the surfactant chemistry. For example, the surfactant Arlacel, with a slightly smaller HLB number than SPAN 80, induces a higher conductivity. It might perhaps happen because the molecules can split at different binding points.
Measurements in different liquid reveal that this conductivity effect depends also on the properties of the liquid. It exists in quite pure liquid, such as 99% pure hexadecane, butyl acetate, toluene, heptane, hexane (see Figure 4). It is interesting that there is no direct correlation with dielectric perimttivity.
But these conductivity measurements of homogeneous liquids provide only limited information. That is why in the next step we will add insoluble dispersed particles for creating a heterogeneous system.
Conductivity measurement of the heterogeneous alumina dispersions
We prepared 5%vl alumina dispersions using the various SPAN 80 solutions as the dispersion media. Figure 5 shows the conductivity for these solutions versus SPAN 80 content. For comparison we plot the conductivity curve for kerosene/SPAN medium. It is clearly seen that the addition of the alumina particles causes a very large change in the conductivity. This change can be explained only by adsorption. This means that alumina particles adsorb substantial amount SPAN 80. There is clearly break point around 1%. Below this point alumina particles adsorb practically all SPAN 80 molecules.
We could also conclude that particle either adsorb both cations and anions, or dramatically change apparent dissociation constant of the SPAN molecules. If dissociation would remain the same and particles would adsorb only one sort of ions, conductivity at this region (<1%) would drop only 2 times. Remaining ions (counter-ions) would maintain at least half conductivity level comparing with the pure liquid. Here we assume following Morrison that sizes and mobilities of ions are about equal.
However, there is still small conductivity in the dispersion at 1 %wt, about 10 pS/cm. Is it related to just one sort of the ions? Is there any difference in adsorption between cations and anions?
In order to get answers to these questions we use electroacoustic technique for characterizing surface charge of the particles.
Electroacoustic measurement of the alumina dispersions
Electroacoustic method works in several steps when applied to non-aqueous systems.
The first step is calibration with 10% silica Ludox in 0.01 M KCl aqueous solution. The bottom line in Table 1 shows values of CVI for this calibration solution. We made six measurements in order to show reproducibility. The zeta potential of this dispersion is –38mV, which is basis for calibration.
The next step is measurement of the electroacoustic signal of the pure kerosene. It is the second from the bottom line in Table 1, called “background”. This gives us value of the background signal. The DT-300 software allows us to save this value and to subsequently subtract this background signal from all further measurements. It is vector subtraction because electroacoustic signal is a vector with a certain magnitude and phase.
As a simple test that this subtraction works, we measured kerosene again, this time making the background subtraction. These values are given in the line “zero”. It is seen that absolute value of the signal reduced 20 times. The noise of the measurement is a few hundreds of absolute CVI units.
All further lines in Table 1 correspond to the alumina-kerosene-SPAN 80 dispersions with suitable background subtraction. It is seen that these values are much larger than values coming from kerosene only. Their amplitude exceeds substantially the noise level.
We can attribute this electroacoustic signal to the particles and calculate their surface charge s using equation 1.6 and 1.7. Figure 6 shows results of this calculation. We use the following values for the properties kerosene and alumina: r m =0.8 g/cm3 ; r p =3.8 g/cm3; h =1.5 cp; e m =2; a=0.5 micron. The CVI was measured at an ultrasound frequency of 3 MHz.
It is seen that surface charge increases with the SPAN 80 content, reaches a saturation value between 1 and 2 % of SPAN content. This is in a good agreement with conductivity data presented on Figure 5.
The sign of the surface charge turns out to be positive. We have two confirmations for this statement. The first is a simple microscopic observation with a microelectrophoretic instrument, a PenKem model 501. The particles move in the electric field as they would if they had a positive charge. The second is the phase of electroacoustic signal. The values of CVI phase are shown in Table 2. It is seen that it is between 0 and 90 degrees, which corresponds to a positive surface charge.
However, one observe that phase values are unusually rather large, large. It is known that in aqueous systems phase shift due to the particle inertia can not exceed 450 [9]. We measure much larger values. Why?
Shilov’s theory gives answer to this surprising fact. It predicts that in the case of overlapped DLs the phase shift due to particle inertia varies from 0 to 900. More specifically, for this system with heavy large particles it is about 500. The large measured values of the CVI phase can be considered as confirmation of Shilov’s theory.
These measurements now allow us to answer the set of questions formulated in the previous section.
It is clear that the cations are in excess on the surface, whereas anions form the counter-ion cloud in the bulk between particles. For SPAN 80 content we could assume that all neutral molecules are on the surface, as well as all cations.
The anions are in the solution. They are responsible for the small conductivity in the dispersion at 1 %wt, with value about 10 pS/cm. The Electroacoustic data allows us to calculate the amount of these anions. Combining the conductivity and electroacoustic data we can estimate the diffusivity and size of these anions.
Diffusivity, size and dissociation constant of SPAN 80 in kerosene
In order to combine the conductivity and electroacoustic data, we can use Eq. 1.3 for the dispersion with 1% SPAN 80 content. In the previous section we established that the conductivity in this case is related to the anions:
![]() (2)
(2)
The concentration of these anions can be determined from the value of the particle’s surface charge s , keeping in mind the electro-neutrality condition between the particle surface and bulk. This lead to the following expression:
![]() (3)
(3)
where j is volume fraction, a is particle radius of assumed monodisperse system, and F is the Faraday constant.
Substituting Eq.3 in Eq.2 we get the following expression for the diffusivity of anions
![]() (4)
(4)
For the dispersion at 1%wt SPAN we have the following values for the relevant parameters: K=10 pS/cm; a=0.5 micron; RT/F=0.025 V; s =5*10E-6 C/m2; j =0.05. The value of the diffusion coefficient for the SPAN 80 anions equals:
![]()
For comparison, this means that diffusion coefficient of SPAN 80 anions is 100 times smaller than the diffusion coefficient of Li+ ion in water [10]. This relatively small diffusion coefficient implies that the SPAN 80 ions are relatively much larger than the Li+ ion, perhaps because they are encapsulated in a protective micelle.
Having now the diffusion coefficient, we can make an approximate estimate of the ion radius ai using the Einstein expression for the diffusion coefficient:
![]() (5)
(5)
Using an approximate viscosity of 1.5 cp, this results in a radius for SPAN 80 anions in kerosene of 14.6 nanometers, or a micelle diameter of about 29 nm, which is surprisingly close to the Bjerrum critical diameter of 28 nm by Morrison [2]. That is why these ionic species exist in non-polar kerosene.
We can also make an estimate of the SPAN 80 apparent dissociation constant in kerosene, using the SPAN 80 data at 1%wt without particles. The molar concentration C0 of SPAN 80 at this point is 2.3 10-2 mol/L because its molar weight is 428 g/mol.
The conductivity of the SPAN 80 solution at this point is about 300 10-10 S/m. In order to calculate concentration of ions using these conductivity data we must assume that cation diffusivity is approximately equal to the anion diffusivity. This leads to the following values of the ions concentrations:
![]()
which in turn leads to the following value of the SPAN 80 apparent dissociation constant Ddiss:
![]()
This value of dissociation constant equals to the value of HIO weak acid dissociation in water. This means that SPAN surfactants behave as weak electrolyte in non-aqueous media.
Conclusions
Measurements of the conductivity and electroacoustic signal in the solutions of SPAN surfactants in various non-polar liquids and alumina-kerosene-SPAN dispersions allow us to formulate the following conclusions about SPAN surfactants.
“Non-ionic” surfactants of SPAN family are actually ionic surfactants in non-polar low-conducting media. They produce substantial amount of ions. There are two possible mechanisms of this effect: dissociation of the SPAN molecules or their stabilization of the ions originally existing in the liquid as neutral ion pairs.
The apparent dissociation constant correlates with the HLB number. The larger the HLB, the larger the dissociation. However, the HLB number is not the only factor that determines the dissociation value.
There is no clear correlation of the apparent dissociation constant with dielectric permittivity of the liquid.
Adsorption of SPAN molecules on the surface of particulates substantially reduces the degree of dissociation.
The diffusion coefficient of SPAN 80 anions in kerosene is about 10-7 cm2 /sec.
The diameter of the SPAN 80 micelle, which is protecting ions is about 30 nm, which aggress with the critical Bjerrum diameter.
The apparent dissociation constant of SPAN 80 in kerosene is 2.4 10-11, which is approximately the same as weak electrolytes in water.
Appendix 1 Shilov’s electroacoustic theory.
In the Introduction we gave a short overview of the role of the parameter ka in electrokinetic and electroacoustic phenomena. This is traditional presentation based on the comparison of the DL thickness with characteristic dimension of the dispersion. In the case of the traditional dilute systems there is only one special parameter to compare Debye length with, it is particle size a. That is why parameter ka is chosen for characterizing many DL related effects.
In concentrated dispersions another special parameter appears, the average distance between particles d. In the case of a “thick DL” this parameter is of greater importance because it determines the degree of DL overlap. In this section we consider the situation when the DLs overlap strongly, which corresponds to the following relationship between Debye length and inter-particles distance:
![]() (1.1)
(1.1)
In this case of strongly overlapped DLs the characteristic space d, accessible for ion redistribution between particles, is smaller than the Debye screening length k -1 and no noticeable deviation form a homogeneous distribution of ions will arise in the dispersion medium. We could neglect these deviations completely, considering the ions concentrations C0± as constant and space independent. This is the essence of the quasi-homogeneous model.
In the frame of the same theoretical approach the local concentrations of cations and anions (upper index “+” and “–“) may be expressed as:
![]() (1.2)
(1.2)![]()
The space-independence of ions concentrations ![]() implies space-independence of the local conductivity
implies space-independence of the local conductivity ![]() :
:
 (1.3)
(1.3)
where D is the diffusion coefficient.
In the frame of quasi-homogeneous model we can derive a simple relationship between the surface charge density s and zeta potential, even without using a cell model (i.e., for arbitrary geometry of disperse phase), just based on the dispersion electro-neutrality:
![]() (1.4)
(1.4)
where s is a surface area per unit volume.
For monodisperse dispersion of spherical particles, when ![]() :
:
![]() (1.5)
(1.5)
This equation reflects a very important distinction between “thin DL” and “thick, overlapped DL”. In the case of the traditional “thin DL” theory, both surface charge and the zeta potential are surface properties, independent on the volume fraction.
In the case of “thick DL”, the surface charge is a true parameter of the surface properties. Electrokinetic zeta potential might lead to erroneous conclusions because it depends on the volume fraction, not only on surface charge. For instance, if we have surface charge caused by adsorption of ions, the value of the surface charge characterizes this adsorption. It keeps constant, volume fraction independent for the same adsorption. At the same time the zeta potential might be different due to the volume fraction dependence. This means that zeta potential value might lead to the wrong conclusions about adsorption. This all indicates that both, zeta potential and surface charge, must be reported when dealing with concentrated dispersions with thick DL.
Shilov’s theory yields the following expression for dynamic electrophoretic mobility m d
 (1.6)
(1.6)
Dynamic electrophoretic mobility is defined as normalized measured CVI:
![]() (1.7)
(1.7)
where: j is volume fraction, r m and r p are densities of the liquid and particle, h is dynamic viscosity, w is frequency of ultrasound, <Ñ P> is gradient of pressure in the ultrasound wave, ![]() – is the average density of suspension; W is a drug coefficient introduced as following in the Stokes law
– is the average density of suspension; W is a drug coefficient introduced as following in the Stokes law ![]() .
.
The applicability of the Shilov’s theory is restricted by the condition of strongly overlapped diffuse layers only. More detail analysis presented in the paper [6] indicates that we could use it almost up to k a=1 if volume fraction is high enough. There is no restriction applied on the frequency of ultrasound.
Literature
Kitahara, A. “Nonaqueous systems”, in Electrical Phenomena at Interfaces, ed. By Kitahara. A. and Watanabe, A., Marcel Decker, 1984
Morrison, I.D. “Electrical charges in non-aqueous media”, Colloids and Surfaces, A., 71, p.1-37, 1993
Bjerrum, N. “A new form for the electrolyte dissociation theory”, Proceedings of the 7th International Congress of Applied Chemistry, Section X, p.55-60, London, 1909
Hancock, R.I. “Macromolecular Surfactants” in “Surfactants”, ed. By Th.F.Tadros, Academic Press, 1983, pp.287-321
Huibers, P., Ph.D.Thesis, www.surfactants.net
Shilov, V.N., Borkovskaja, Yu.B., and Dukhin A.S. “Electroacoustic theory for concentrated colloids with arbitrary k a. Nano-colloids. Non-aqueous colloids.”, JCIS, submitted
Sumitomo Chemical Company Limited, www.sumitomo-chem.co.jp/english
Dukhin A.S. and Goetz. P.J. “Ultrasound for characterizing colloids”, Elsevier, 2002
O’Brien, R.W., Cannon, D.W. and Rowlands, W.N. “Electroacoustic determination of particle size and zeta potential”, JCIS, 173, 406-418, 1995
Bockris, J. and Reddy, A.K. “Modern electrochemistry”, vol.1, A Plenum/Rosetta edition, 1977.
Winget, P., Dolney, D.M., Giesen, D.J. and Cramer, C.J. “Minnesota solvent descriptor database”, Dept. of Chemistry and Supercomputer Inst., University of Minnesota, Minneapolis, MN 55455, 1999.
Figures Titles
Figure 1. Photograph of DT-300 Zeta Potential Probe inserted into the alumina-kerosene-SPAN 80 dispersion.
Figure 2. Conductivity of the kerosene solutions with various surfactants.
Figure 3. Conductivity of the kerosene solutions with various surfactants on logarithmical scale.
Figure 4. Conductivity of the various non-polar liquids with SPAN 80.
Figure 5. Conductivity of the SPAN 80 in kerosene solutions with and without alumina AKP-30 particles at 5%vl.
Figure 6. Surface charge of alumina AKP-30 particles at 5%vl in kerosene with various concentrations of SPAN 80.
Table 1. Electroacoustic signal magnitude.
| Measurement# | #1 | #2 | #3 | #4 | #5 | #6 |
|---|---|---|---|---|---|---|
|
5% |
22231 |
22285 |
22961 |
|||
|
3% |
30691 |
31498 |
31211 |
|||
|
2% |
33898 |
34556 |
35062 |
|||
|
1% |
19301 |
20193 |
20636 |
|||
|
0.8% |
13669 |
13307 |
12251 |
|||
|
0.7% |
10604 |
10791 |
11005 |
|||
|
0.6% |
7564 |
7258 |
8456 |
|||
|
0.5% |
5250 |
5648 |
6388 |
|||
|
0.4% |
4413 |
4217 |
4570 |
|||
|
0.3% |
1265 |
602 |
1900 |
|||
|
0.2% |
1877 |
1536 |
1234 |
|||
|
Zero |
598 |
845 |
440 |
941 |
949 |
1088 |
|
background |
20471 |
20448 |
20635 |
20127 |
20754 |
20649 |
|
Ludox |
3555251 |
3562095 |
3556190 |
3776771 |
3750890 |
3747398 |
Table 2. Electroacoustic signal phase and ka values for various alumina-kerosene-SPAN 80 dispersions assuming diffusion coefficient 10-7 cm-2 /sec.
Measurement date
| SPAN content %wt | CVI phase | ka | |
|---|---|---|---|
|
1/23/2004 2:10:33 PM |
5 |
68.7 |
6 |
|
1/23/2004 1:51:58 PM |
3 |
77.7 |
4.2 |
|
1/23/2004 1:38:14 PM |
2 |
77.9 |
2.6 |
|
1/23/2004 1:11:46 PM |
1 |
83.5 |
0.92 |
|
1/22/2004 1:07:00 PM |
0.8 |
62.3 |
1.1 |
|
1/22/2004 12:53:53 PM |
0.7 |
59.2 |
0.84 |
|
1/22/2004 12:39:51 PM |
0.6 |
74.6 |
0.71 |
|
1/22/2004 12:23:11 PM |
0.5 |
65.9 |
0.6 |
| 1/22/2004 12:14:07 PM |
0.4 |
69.9 |
0.64 |
|
1/22/2004 11:36:36 AM |
0.3 |
45.9 |
0.5 |
|
1/22/2004 11:21:06 AM |
0.2 |
57.5 |
0.4 |
Figure 1.
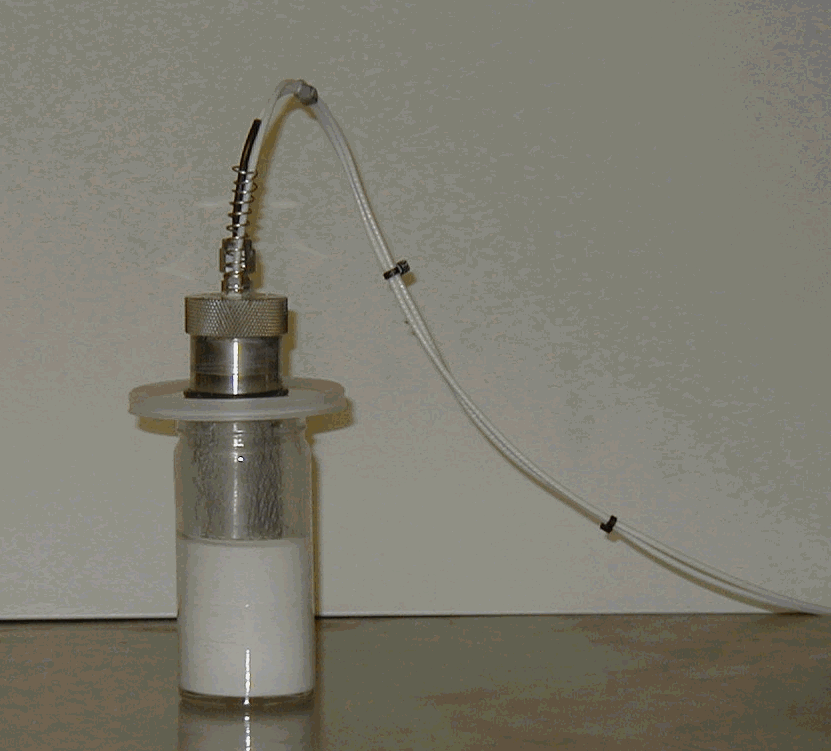
Figure 2.
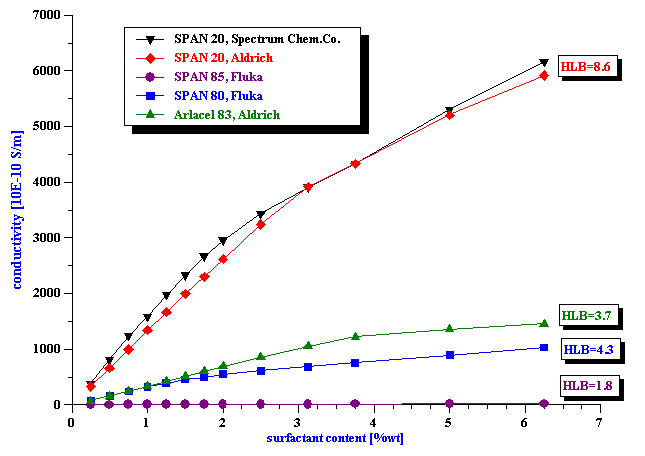
Figure 3.
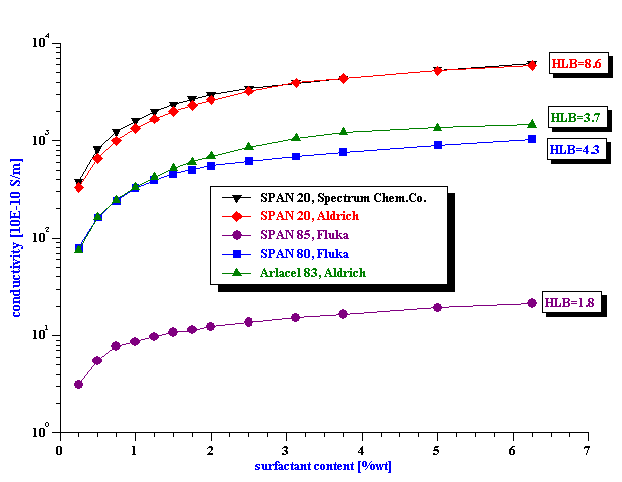
Figure 4
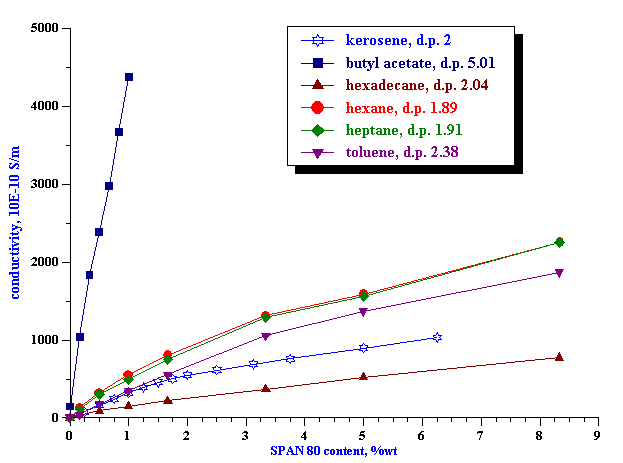
Figure 5.
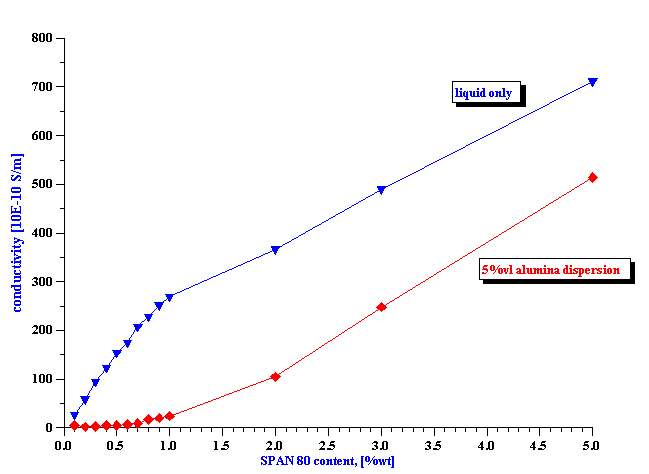
Figure 6.
