ULTRASOUND FOR CHARACTERIZING LIQUID BASED FOOD PRODUCTS. 1. Acoustic Spectroscopy.
A.S.Dukhin and P.J.Goetz
Dispersion Technology Inc, 364 Adams Street, NY 10507
B.Travers
Anatom Technology Ltd, 2803 Shady Grove Court, Baldwin, MD, 21013
Abstract.
It is known for a long time that ultrasound offers unique features for characterizing liquid based food products in their intact state, with no sample preparation and no sample destruction. It can be used for on-line process control, which makes it even more attractive. However, it is used still mostly in research environment, except perhaps a single industrial application for monitoring alcohol content. We think that it is a time to promote ultrasound to food industry more aggressively. In order to do this we prepare this review that gives answers to the most essential questions:
What information about food products can we extract from ultrasound measurement?
What is better parameter for characterization procedure, attenuation or sound speed?
Why ultrasound attenuates propagating through heterogeneous system?
What is potential range of attenuation and sound speed in food products?
What precision of the attenuation and sound speed measurement is required?
What frequency range is required?
It turns out that it is possible to provide answers to these questions using mostly experimental data avoiding complex mathematical analysis. We present also several applications of acoustic spectroscopy for characterizing real food products. These applications include:
Characterization of alcohol in water content using sound speed, but not attenuation;
Characterization of fat content in wide variety of dairy products using attenuation;
Calculation of fat droplet size distribution in milk with no dilution;
Calculation of water droplets in butter with no dilution or melting;
Characterization of chemical reactions when milk is spoiling using sound speed;
Stability of orange oil in water emulsions,
Sensitivity of emulsion to the shear stress.
Measurements were made with Acoustic and Electroacoustic Spectrometer DT-1200 by Dispersion Technology Inc.
The second part of this material covers application of Electroacoustics to the food products.
Introduction
Ultrasound propagating through a continuous liquid system interacts with it and changes its properties, such as intensity and phase. Decay of the ultrasound intensity usually refereed to as “ultrasound attenuation”. Ultrasound phase is related to the speed of ultrasound propagation through the particular liquid system. Variation of these two properties of ultrasound (attenuation and sound speed) would depend on the properties of the system. If we measure variation of the ultrasound properties then we would be able to extract some information about properties of the system.
It is an old idea. Historical overview of its development for heterogeneous liquid based system in the course of last century is given in the recently published book [ 1 ]. As a result of this development we have a complete understanding of the mechanisms of the ultrasound propagation through the heterogeneous systems. This understanding enabled us to build instruments, which employ ultrasound for characterizing a wide variety of real heterogeneous systems. Currently about 150 groups world wide are using this new technology for characterizing ceramics, paints, latecies, emulsions and microemulsions, cements, clays, various oxides, abrasive materials, cosmetics, nano-materials. In this review we would like to show how this technique might work for food products.
We start with describing general principles of measurement. Then we present data collected for various dairy products.
Ultrasound measurement.
There are two most accepted approaches to the measuring variation of the ultrasound properties due to interaction with liquid system: “interferometric” and “transmission”. We present the general principles and differences between these two approaches in the book [1]. It is usually admitted on the field that “transmission” approach is more suitable for measurement of ultrasound “attenuation”. Here we will show that this approach can be as good as the other one for the “sound speed” measurement as well. That is why we will talk only about this approach from now on.
Figure 1 illustrates the main principles of the “transmission” approach. Piezo-crystal transmitter generates ultrasound pulse of certain frequency and intensity and launches it into the sample. Intensity of pulse decays due to the interaction with the sample. Piezo-crystal received converts this weaker pulse back to electric pulse and sends it to electronics for comparison with the initial pulse. This means that intensity of the pulse after propagation through the sample is a raw data.
In addition we can measure time of the pulse propagation and its phase.
Figure 1. Block scheme of “transmission” acoustic spectrometer.
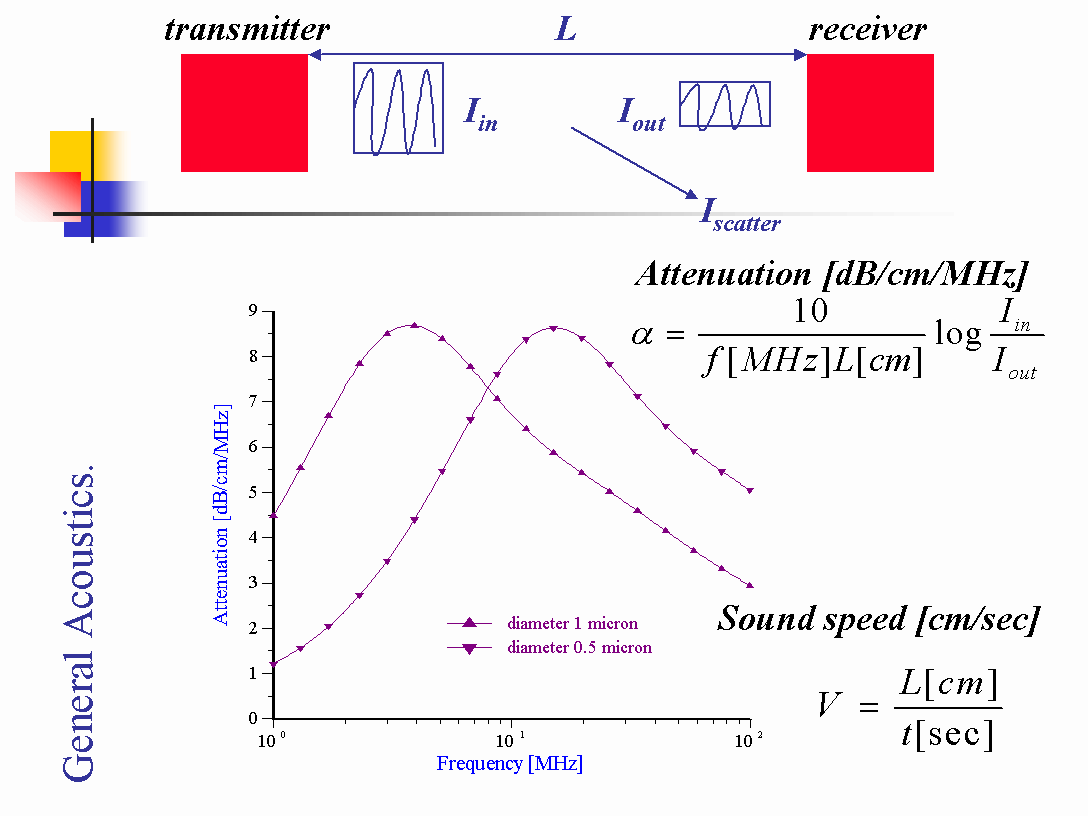
It might be interesting for user to mention here an analogy between ultrasound and light measurements. In the case of light we measure scattered energy at certain angle, as it is shown on Figure 1. In principle, it would be possible to do the same for ultrasound. However, it turns out that measurement of transmitted energy has advantage of being unaffected by multiple scattering. It is clear that forward propagating pulse precedes multiple scattering. It decays only due to the single scattering. This peculiarity of ultrasound measurement is know for a long time [ 2 ]. It eliminates multiple scattering problem completely. This is one of the biggest advantages of ultrasound based techniques over light based with regard to concentrated systems.
What information about food products can we extract from ultrasound measurement?
Interpretation of the acoustic raw data can be done in several steps depending on the level of dispersed system modeling involved.
The first step is pure phenomenological, it requires no assumptions or models of the system that is under investigation. This step includes calculation of either Acoustic or Rheological parameters of the system. Acoustic parameters are attenuation and sound speed. There are expressions on Figures 1 and 2 that gives relationship between raw data (output intensity and time of flight) and acoustic parameters.
There is also opportunity to calculate Rheological parameters according to the equations on Figure 2. It should be taken into account that these are “longitudinal” visco-elastic properties. They differ from traditional “shear” visco-elastic properties because stress is normal, not tangential. They are also measured at high frequency, which leads to much higher values than usual rheological data. However, these rheological parameters can be used for empirical correlations with observed processes, same as traditional shear visco-elastic parameters.
Figure 2.
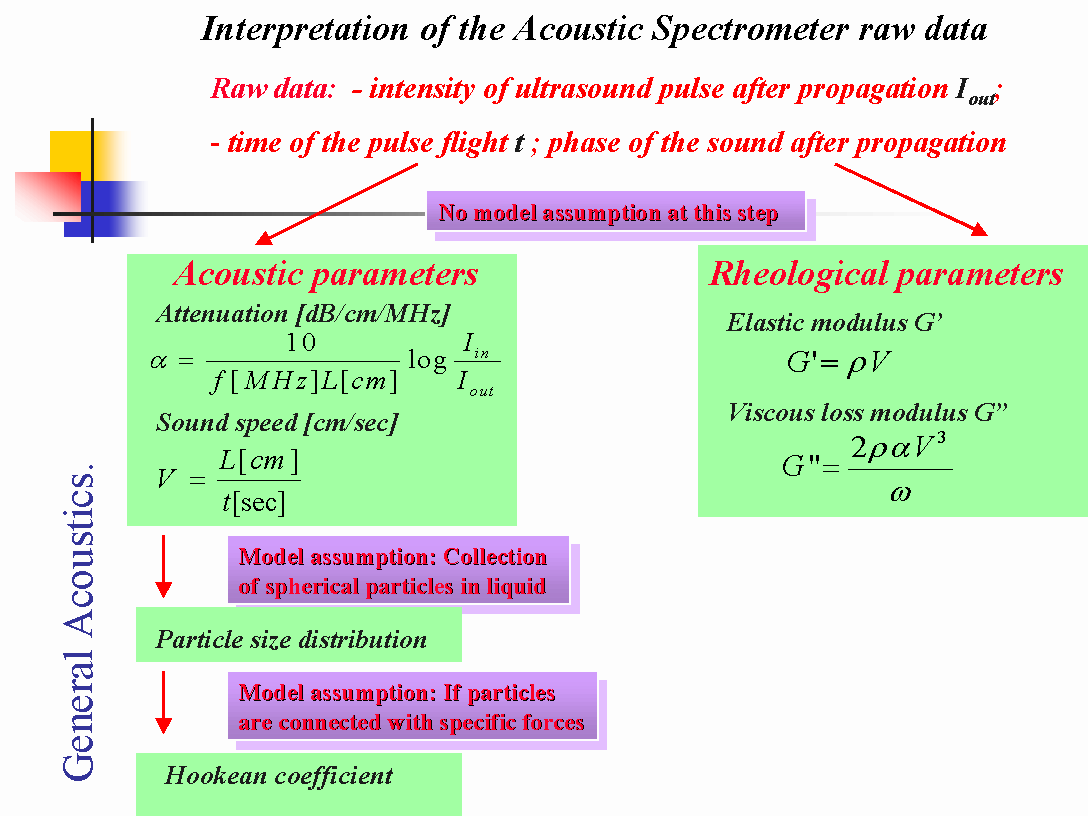
The next step of interpretation requires modeling of the real dispersed system. If the adequate modeling is available for particular dispersion, acoustic properties can be converted into the particle size distribution, or properties of the specific forces bounding particles together in structured dispersions. For instance, we can calculate size distribution of the fat droplets in milk because we can model milk as a collection of fat droplets in water solution of proteins, sugars, etc. We are able to perform a similar calculation even in butter for size of the water droplets in the milk fat.
These calculations would require a theory of the sound propagation in heterogeneous system. Our recent book [ 1 ] offers a general overview of this theory. We can state that an adequate theory exists, even for very concentrated systems, up to 50%vl, potentially structured or contained several dispersed phases. This statement is verified in the Chapter 6 of our book.
What is better parameter for characterization procedure, attenuation or sound speed?
As we mentioned above, there are two measurable acoustic parameters: attenuation and sound speed. The question arises which one is better for characterizing particular effect in the given food product. There are two answers to this question in general scientific literature. For instance, very well known scientist on the field of ultrasound characterization of food products, J.McClements stresses importance of the sound speed [ 3 ]. In a contrary, our group in Dispersion Technology Inc relies mostly on attenuation. It is clear that this question deserves a special consideration.
Figure 3. Sound speed of water versus concentration of various simple chemicals.
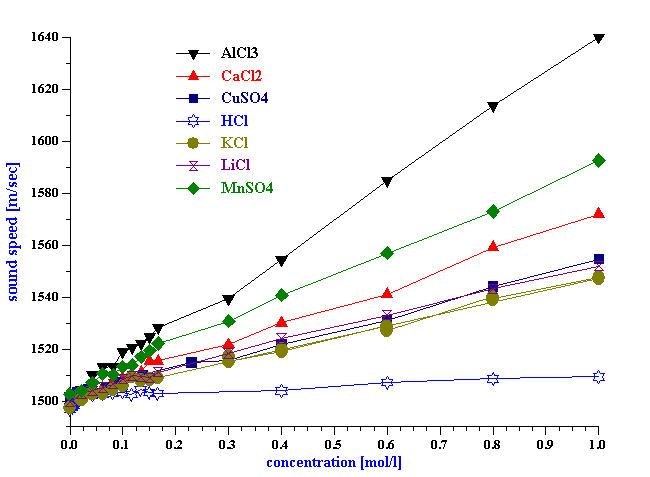
We have performed a several simple tests for answering this question. First of all we have measured sound speed of water varying concentration of several simple chemicals. It turns out that sound speed is very sensitive to the chemical composition. It changes roughly 100 m/s per 1 mol/l of the simple salt. We will show later that it is possible to measure sound speed with precision of roughly 1 cm/s. This means that with the sound speed we would be able to monitor variation of chemical composition of water with precision of 0.0001 mol/l.
Sound speed is also very sensitive to the temperature. For water it changes 2.4 m/sec per degree Celsius.
Figure 4.
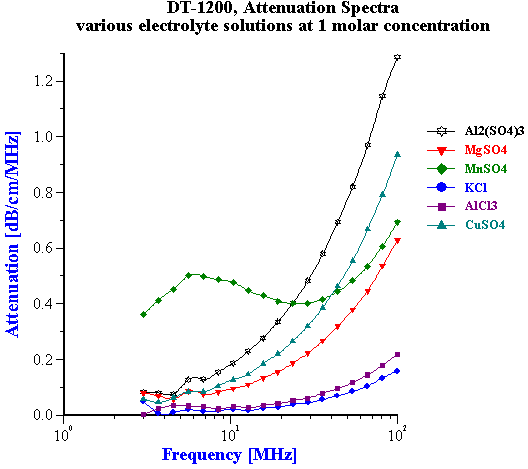
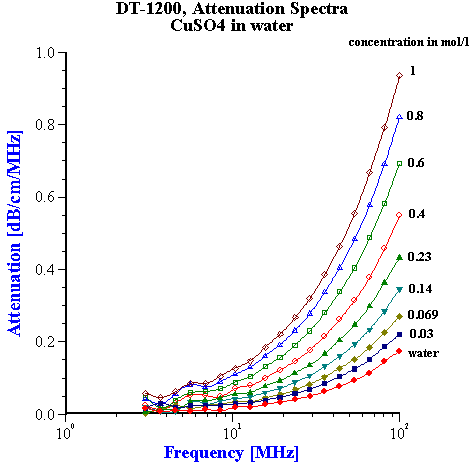
Attenuation in turn is much less sensitive to the chemical composition. Figure 4 shows attenuation spectra of water at 1 mol/l concentration of similar chemical additives. It is seen that even at this very high concentration it changes significantly only for rather charged ions. This influence is much less pronounced at lower concentration, which we could expect in food products. Figure 5 shows that even for 2:2 valency salt it changes 0.1 dB/cm/MHz only at 0.14 mol/l. It might be generally concluded that impact of chemical variation on attenuation is negligible if concentration varies less than 0.1 mol/l.
Figure 5.
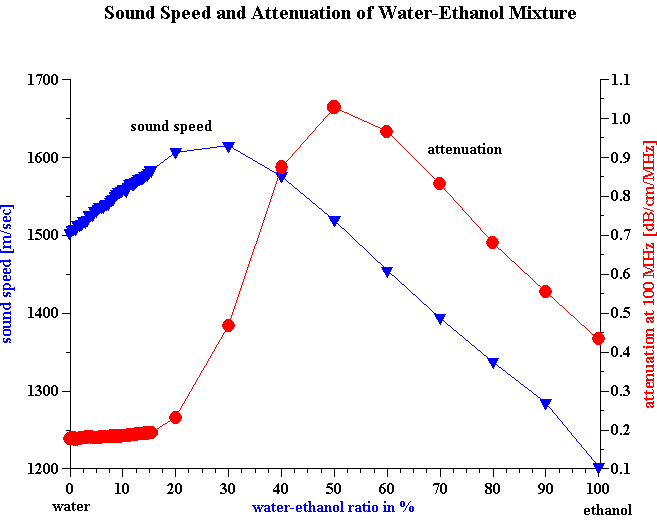
This differences in sensitivity of sound speed and attenuation to the chemical composition is one of the reasons why sound speed and not attenuation is used for monitoring alcohol content in brewing industry. Figure 6 shows dependence of sound speed and attenuation on the water-ethanol ratio in their mixtures. It is seen that sound speed begins to change even at very low ethanol content, whereas attenuation remains constant up to 15% ethanol content.
Attenuation is very little sensitive to the molecular and ions composition, but it changes dramatically with composition of dispersed phase. We will show this later for various food emulsions.
In other terms, attenuation reflects variation occurring on the scale of colloid sizes, from nanometers to microns, whereas sound speed is more representative for effects that are originated on the molecular scale of angstroms.
This simple analysis indicates that sound speed is the better parameter for investigating effects on the molecular scale, whereas attenuation is more suitable for characterizing effects related to the heterogeneity and phase composition of the particular system.
Figure 6.
Why ultrasound attenuates propagating through heterogeneous system?
There is a general formula describing propagation of any energy field through the heterogeneous system:
extinction (attenuation) = scattering + absorption
According to the Webster dictionary:
Scatter:
to separate and go in several directions; to reflect and refract in an irregular diffuse matter;
Absorption:
a taking in and not reflecting.
Applying these definitions to ultrasound we can say that ultrasound is being scattered and absorbed while propagating through the heterogeneous system. Scattering is simply redirecting of the ultrasound energy by particles away from the propagation path. Absorption is a conversion of ultrasound energy into heat due to interaction with particles in media.
There are several simplifications, which are valid for many food products.
Submicron particles do not scatter ultrasound at all. They only absorb it.
Density of the particles in food products usually very close to the density of the liquid. This eliminates all hydrodynamic effects. Propagation of ultrasound through the food products with a low density contrast is thermodynamic in nature.
It is quite easy to imagine scattering of ultrasound. It is essentially the same as light scattering. Actually the first ideas of scattering were created by Lord Rayleigh for sound, not light. He has published two books with title “Theory of Sound” [4].
It is more complicated to imagine absorption of ultrasound by particles and media. In order to simplify this effect, it has been split on two parts: absorption by particles and absorption by liquid media.
Absorption by liquid media is usually called “intrinsic attenuation”. It occurs due to a variety of interactions on the molecular level. Attenuation shown on Figures 4 and 5 are examples of intrinsic attenuation of water with different chemical compositions.
Intrinsic attenuation is measurable parameter. It is used usually as is, with no particular theoretical interpretation.
Intrinsic attenuation of pure water, or other pure liquid can be used as its fingerprint. It is useful for testing instrument performance. For instance, Dispersion Technology Inc instruments relies on water as testing sample.
There is direct relationship between intrinsic attenuation and viscosity of the liquid, discovered first time by Stokes in 1845 [5].
Absorption of ultrasound by particles with low density contrast is usually called “thermal attenuation”. It has been suggested 60 years ago by Isakovich [6].
In the case when density of particle matches density of the liquid, there is no relative particle-liquid motion. However, compressibility of these soft particles is usually different than compressibility of liquid. As a result, particle and liquid expand and contract at different rate in the ultrasound field. This difference creates a tiny temperature gradient on the particle-liquid border. Energy flow on this border is irreversible according to the thermodynamic principles, which produces heat. Particles convert ultrasound energy to heat and ultrasound attenuates.
We can use analogy with refrigerator. It is known that it generates heat due to thermodynamic effect. We can model particles as tiny refrigerators that generate heat by taking energy from the ultrasound wave.
This strange effect is quite measurable, as we will show later. It is dependent on the thermodynamic properties of the liquid and particles, such as heat conductance, thermal expansion and heat capacity at constant pressure. These parameters are known for many liquids. Thermal expansion coefficient is the most important because the other two are almost constant for all liquids [1, p. 23]. Thermal conductance is close to 1 mW/ cm K, whereas Cp varies in the range from 0.5 to 3 for almost all liquids.
Thermal attenuation depends also on the size of the particles. Detail theory is given in the book [1].
It turns out that particle size and in many cases thermal expansion can be calculated from the measured attenuation spectra. We will illustrate this below with milk and butter.
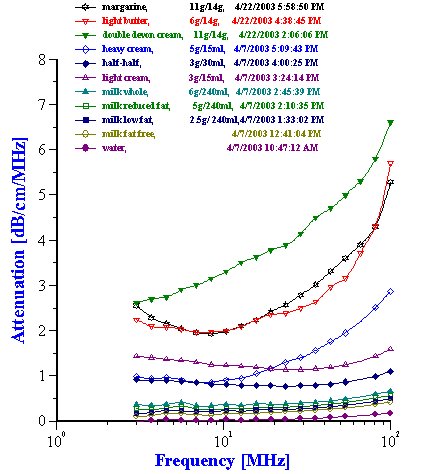
Figure 7. Attenuation of various dairy products.
What is potential range of attenuation and sound speed in food products?
Sound speed is within range 1000-2000 m/s for practically all food products. For water based food products it would be close to 1500 m/s, which is sound speed of water at room temperature.
Attenuation varies in much wider dynamic range. That is why it is normally expressed on logarithmic scale in “decibels” [dB].
Water is the least attenuating liquid. Its attenuation expressed in units [dB/cm/MHz] increases linearly with frequency reaching 0.2 at 100 MHz.
Figure 7 shows a family attenuation curves measured for dairy products with different fat content.
According to our experience, acoustic spectrometer must be able to cover dynamic range from water up to 20 dB/cm/MHz for a complete frequency range from 1 to at least 100 MHz.
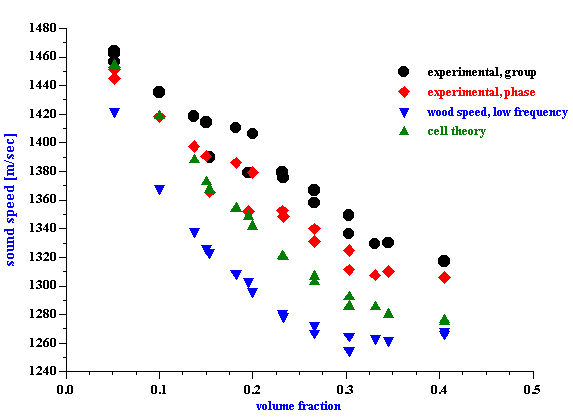
Figure 8. Precision test with low fat content milks.
What precision of the attenuation and sound speed measurement is required?
Precision of the acoustic measurement depends directly on the precision of the other parameters characterizing system that is under investigation.
For instance, it is practically impossible to maintain temperature of the sample and instrument uniform with variations less than 0.01 C. We know that variation of temperature of 1 C leads to the sound speed variation of water 2.4 m/s. Following this numbers, variation of 0.01 C correspond to the variation of sound speed of about 1 cm/s, which is about 10-5 fraction of the absolute sound speed.
Higher precision of the sound speed measurement makes no sense because uncontrolled temperature variations would mask it.
It is possible to make a similar estimate of the sound speed measurement precision using chemical composition variations. It is known that marinating dissolved ions and molecules composition in water with precision higher than 10-4 mo/l is practically impossible. Adsorption of various chemical species from the atmosphere would create larger uncontrolled variations. Figure 3 indicates that sound speed changes about 100 m/sec per 1mol/l of the simple salts. This leads us to the sound speed precision of 1 cm/s for the smallest controllable variations of the chemical composition. It is interesting that this level of precision is practically identical to the one calculated from the temperature stability requirement.
Unfortunately, it is impossible to estimate precision of attenuation measurement using similar analysis. As we mentioned above, attenuation is much less sensitive to the chemical composition and temperature variations. Attenuation depends mostly on the composition and state of the dispersed phase, particles. As a result precision of its measurement must be related somehow to the particles.
We have done this using resolution of the attenuation measurement for characterizing content of the large particles [1, Chapter 8]. It turns out that in order to resolve a single 1 micron particle on the background of the 100 000 particles with size 100 nm, attenuation must be measured with precision of 0.01 dB/cm/MHz.
Figure 8 shows that it is possible to measure attenuation with this level of precision for food products.
What frequency range is required?
The wider frequency range, the more information about system can be extracted. As an example we can use particle sizing using acoustic attenuation measurement. It turns out that measurement within frequency range from 1 to 100 MHz makes it possible to characterize sizes as small as 5 nm, as it has been shown with water-in-heptane microemulsion [1, p188]. Restricting frequency range to the lower frequencies would limit dramatically the small size limit. It would also restrict ability to characterize details of the article size distribution. The specified above frequency range makes it possible to characterize bimodality, which would be impossible if high frequencies are not included in the measurement. We show how this particle sizing works for food products in the following section.
Particle sizing in milk and butter.
Milk is an obvious candidate for verifying particle sizing capability of ultrasound based techniques. It is oil-in-water emulsion with well-known fat content. In addition to fat droplets water contain a certain controlled amount of proteins and sugars. Usually it is considered as complicating factor. However, it is possible to include contribution of proteins and sugars into intrinsic attenuation of liquid. Figure 8 shows that there is certain reproducible measured difference between water and “fat free milk”. This is proteins and sugars contribution. We can use attenuation of the “fat free milk” as intrinsic attenuation when calculating droplet size of fat in the milks with the same proteins and sugars content.
Calculated droplet size distribution of fat for whole milk with attenuation shown on Figure 7 is given on Figure 9. The second graph on this Figure illustrates contributions of intrinsic attenuation (fat free milk) and thermal attenuation (fat droplets) to the total measured attenuation. Thermal attenuation is calculated using the following thermal properties of the milk fat: thermal conductivity=4, Cp=1.3, thermal expansion=6.2.
The more interesting feature of acoustic attenuation characterization procedure is that it allows to characterize droplet size distribution even in gel like systems, like butter with no dilution or melting. It is possible because thermal attenuation effect is thermodynamic in nature, it does not require relative droplet-liquid motion.
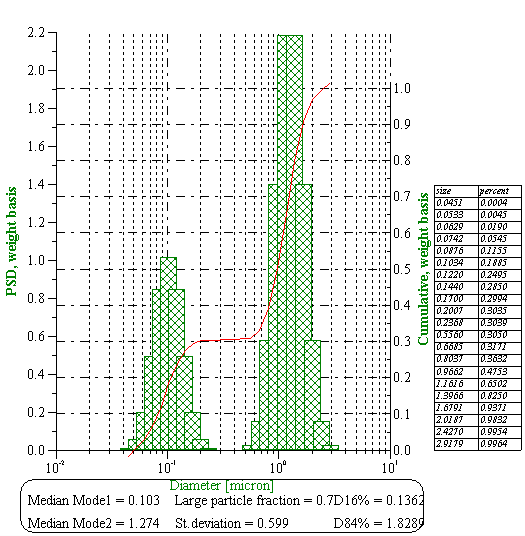
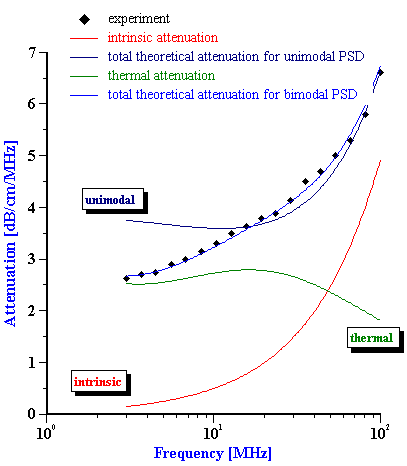
Figure 10 shows size of the water droplets in butter with the measured attenuation shown on Figure 7. The second graph on the Figure 10 presents theoretical attenuations with intrinsic and thermal contributions. Intrinsic contribution is much higher in this case because it corresponds to the pure fat, not to water. This calculations use the same thermodynamic properties of the fat as in the case of the whole milk.
It is important to mention here that measurement of attenuation for butter becomes possible at temperature about 20 C. Butter becomes soft at this temperature, which make it possible to fill measuring chamber. Measurement must be performed in the mode when gap between transducer and receiver closes. It is opposite to the normal mode of DT-1200 functioning.
We also observed that attenuation of butter is much less stable and reproducible than attenuation of milk. It is not clear yet should we attribute this to the instability of the sample or inability to fill measuring chamber properly.
Figure 9. Size distribution of the fat droplets in the whole milk calculated from the attenuation spectra shown below with theoretical fit.

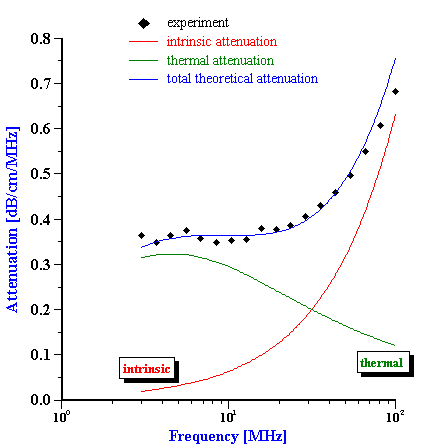
Figure 10. Size distribution of the water droplets in the butter calculated from the attenuation spectra shown below with theoretical fit.
Determination of the fat content using attenuation measurement.
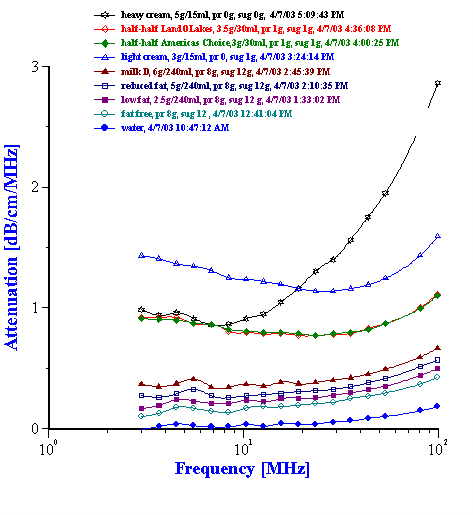
Fat content is very important quality control parameter of the dairy products. It turns out that attenuation measurement offers a simple way to characterize it with no special treatment of the sample. Figure 7 shows attenuation spectra of the various dairy products. It is clear that attenuation increases with increasing fat content. Figure 11 makes it more visible for oil-in-water dairy products.
Figure 11. Attenuation of the oil-in-water dairy products.
It is convenient to characterize the fat content plotting attenuation versus fat weight fraction for all measured products at certain selected frequency. Figure 12 shows this dependence at the frequency 44 MHz. It is seen that there is practically linear correlation between attenuation and fat content. This might be used as a simple and direct way of determining this parameter.
Figure 12. Attenuation of oil-in-water dairy products at one frequency versus fat content. 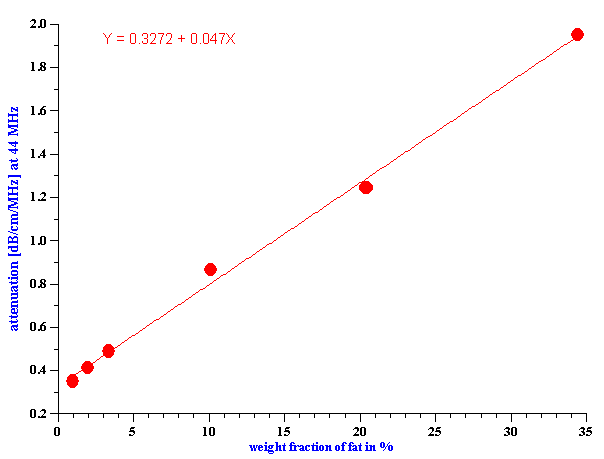
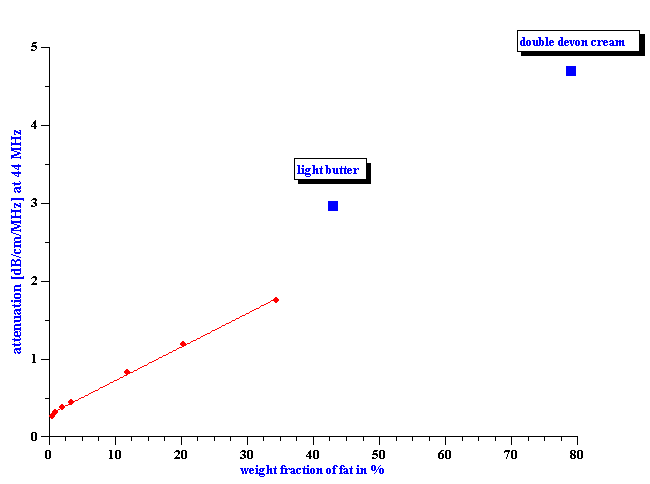
Figure 13. Attenuation of the half-half milk from to different brands.
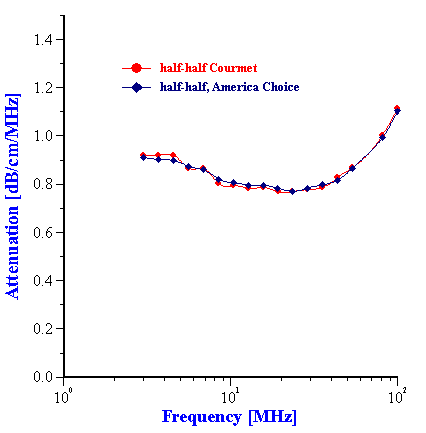
We might expect a high reproducibility of this procedure because attenuation spectra measured for different brands of the same dairy product are practically the same. Figure 13 shows this for two different half-half milks.
Characterization of chemical reactions when milk is spoiling using sound speed.
Spoiling of milk is clearly related to the complex bio-chemical reactions. This means that sound speed must vary in time when milk is getting spoiled because, as we stated above, sound speed is sensitive to the chemical composition of the system. Expected sound speed changes are small. Monitoring of these changes requires stabilization of temperature. In the current experiment we maintain temperature within 0.05 C and measured it with precision of 0.001 C. Sample of the whole milk has volume of 100 ml. Magnetic stirrer mixes sample in order to keep it homogeneous. It turns out that homogeneity of the sample could be maintained only within roughly 12 hours. After this time oil separates from the water and measurement becomes meaningless.
Figure 14. Sound speed versus time for whole milk at two different temperatures.
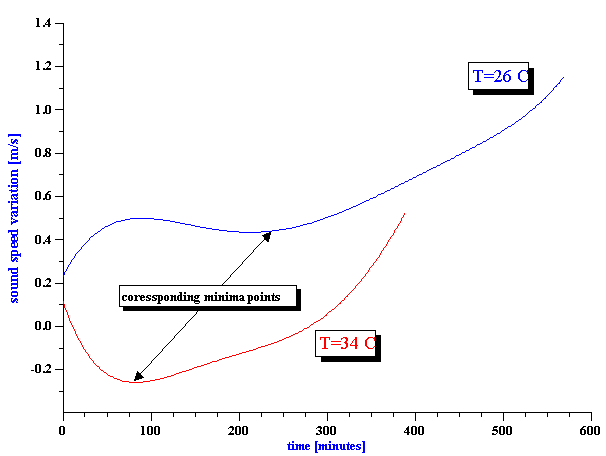
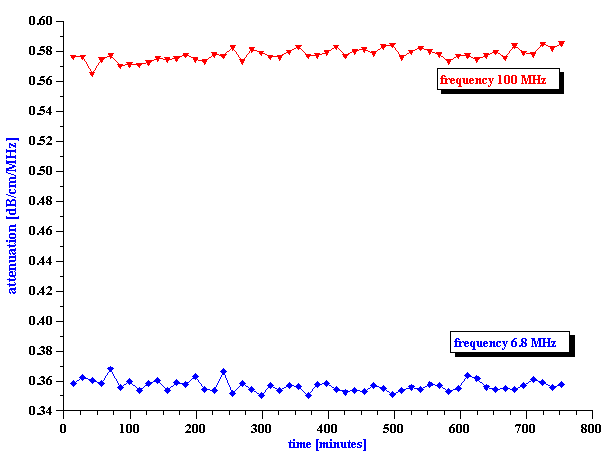
There is one more opportunity to verify data. It is temperature dependence of bio-chemical reactions. It is clear that reaction must be faster at higher temperature. That is why we made measurement at 2 different temperatures: 26 and 34 C.
There are two methods two measure sound speed in “transmission technique”: time of flight measurement and phase measurement.
Time of flight measurement yields absolute sound speed but with rather poor precision. Currently we have precision of this method about 30 cm/s.
Phase measurement is much more precise. We can have precision of 1 cm/s, which has been justified above. However, it is not absolute measurement because we do not know how many cycles occurs during the propagation. This measurement yields only variation of the sound speed.
Figure 14 shows results of the sound speed measurement. It is the phase measurement. Data collection is fast, about 1 minute for a single point.
It is seen that curves shifts to the shorter time with temperature indeed, as expected.
It is interesting that there is practically no change in attenuation. The second graph on Figure 14 illustrates attenuation at two selected frequencies for the whole milk at 26 C. It is seen that attenuation remains constant within precision range for almost 12 hours. It is indication that size of the fat droplets remains the same during the first stage of the spoiling.
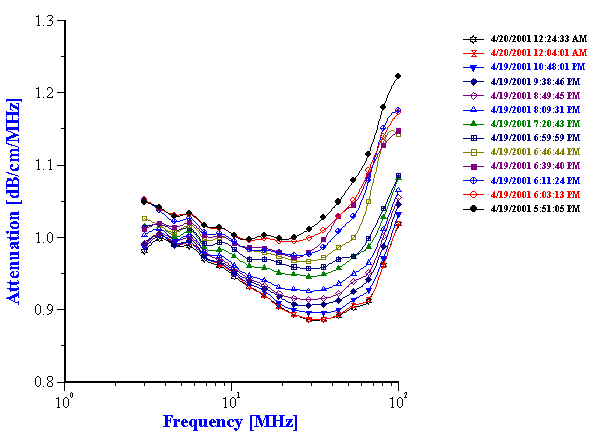
Figure 15. Attenuation spectra of the unstable 10%wt orange oil-in-water emulsion.
Stability of orange oil in water emulsions.
Example with milk does not mean that attenuation of the food emulsions always remains constant when stability changes. For instance, attenuation of unstable orange oil-in-water emulsion changes in time as it is shown on Figure 15.
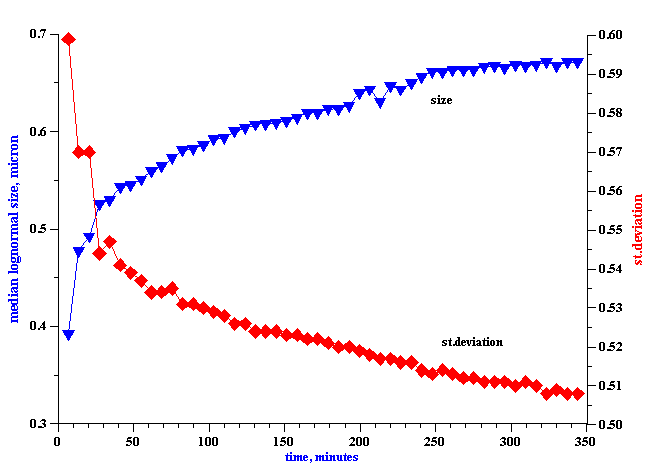
It is seen that the attenuation changes continuously over the course of the 18 hours experiment. There are two effects occurring simultaneously. First, the general attenuation decreases during the experiment; this decrease reflects the creaming of the orange oil, and the resultant decrease in the weight fraction of the oil phase which is still within the path of the sound beam. Second, in addition to this obvious creaming effect, the attenuation spectra changes shape, a reflection of the evolution of the droplet size, due to coalescence. Figure 16 shows the time dependence of the median droplet size and its standard deviation, as calculated from these attenuation spectra depicted in Figure 15. It is seen that the median size grows almost twofold, from 400 nm to 700 nm, in the first six hours. It is interesting that during this time, the width of the droplet size distribution becomes narrower, which implies that smaller droplets coalesce at a faster rate than the larger ones.
Figure 16. Time variation of orange oil droplet mean size and standard deviation.
Sensitivity of emulsion to the shear stress.
In general, the stability of an emulsion depends not only on the surfactant content, but also on any applied shear stress. By applying a shear stress to the emulsion, we might cause two opposing effects: coalescence of smaller droplets into larger ones, and a disruption of larger droplets into smaller ones. Quite often it is not clear which process might predominate. Acoustic spectroscopy offers a useful way to answer this question.
Figure 17. Attenuation of the 19%wt oil-in-water emulsion under continuous shear.
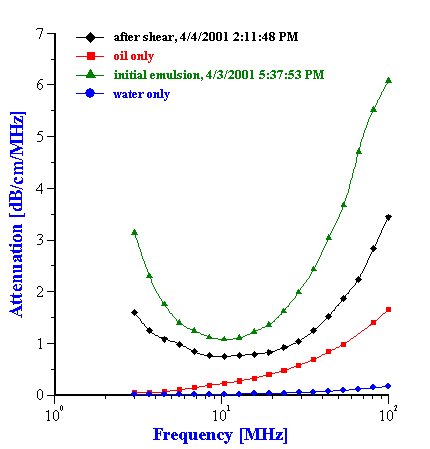
To address the question concerning the effect of shear, the attenuation spectra for a 19%wt anionic oil-in-water emulsion was continuously measured, while the emulsion was pumped continuously for 20 hours with a peristaltic pump. The topmost curves in Figure 8.17 show the first and last attenuation spectrum from this long experiment. The gradual time dependence during this experiment is illustrated in the left hand plot in Figure 8.18, which shows the attenuation at only two selected frequencies (4 MHz and 100 MHz), versus time. It is seen that the shear-induced attenuation changes quite smoothly from the first to the last measurement.
Figure 18. Variation of the attenuation and droplet size of the 19%wt oil-in-water emulsion, due to
shear.
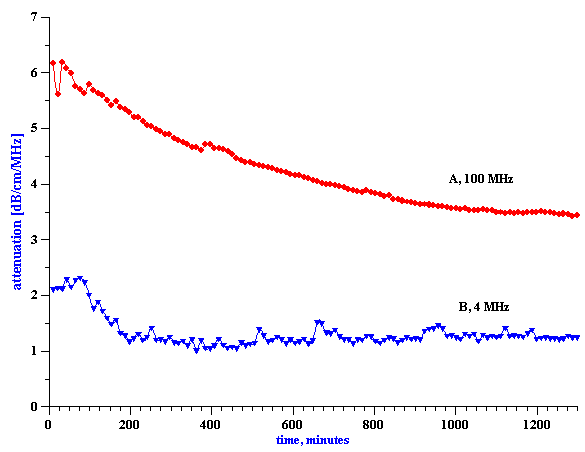
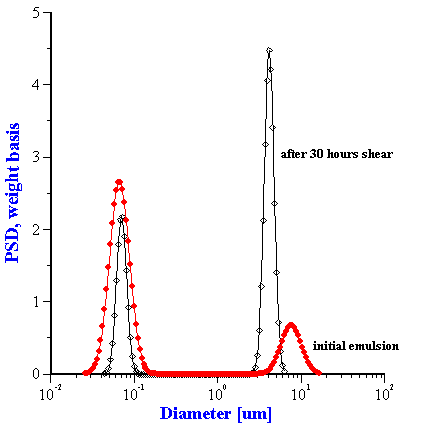
Even more significantly, however, we see that there are two quite different characteristic time constants associated with this shear-dependent change. The attenuation at 4 MHz changes rather quickly during the first 200 minutes, and then remains more or less constant. In contrast, the attenuation at 100 MHz changes exponentially over the 20 hour experiment, and apparently has still has not reached a steady state value at the end. We think that the variation of the low frequency attenuation reflects the breakdown of larger particles into smaller ones, whereas the change in the high frequency attenuations reflects coalescence of smaller particles into larger droplets. The right hand graph in Figure 8.18 illustrates the droplet size distribution at the beginning and end of the experiment.
Conclusions.
Acoustic Spectrometer yields experimental data for characterizing acoustic (sound speed and attenuation) and high frequency extensional visco-elastic properties;
Acoustic attenuation frequency spectra is better property for characterizing dispersed phase and phase composition. In particular it be used for calculating particle (droplet) size distribution when appropriate system model is available;
Attenuation is little sensitive to the temperature;
Sound speed is better for characterizing chemical composition or chemical reactions that occur on the molecular level;
Sound speed is very sensitive to the temperature;
Attenuation of the food products varies from 0.01 dB/cm/MHz up to 20 dB/cm/MHz within frequency range from 1 to 100 MHz. It is very much frequency dependent;
Sound speed of the food products varies from 1000 to 2000 m/s. It is little sensitive to the frequency;
Attenuation measurement requires precision of 0.01 dB/cm/MHz;
Sound speed measurement requires precision of 1 cm/s with temperature stabilization under 0.1 C;
Acoustic attenuation at a single frequency can be used for characterizing fat content of the dairy products;
Acoustic attenuation yields information about fat droplet size distribution in various milks;
Acoustic attenuation yields information about water droplet size in butters with no melting and dilution;
Sound speed is an indicator of bio-chemical reactions in milk;
Acoustic attenuation makes it possible to monitor variation of droplet size distribution in unstable food emulsions;
Acoustic attenuation makes it possible to monitor variation of droplet size distribution in food emulsions under shear conditions.
References.
Dukhin, A.S. and Goetz, P.J. “Ultrasound for characterizing colloids. Particle sizing, Zeta potential, Rheology”. Elsevier, 2002
Morse, P.M. and Uno Ingard, K., “Theoretical Acoustics”, 1968 McGraw-Hill, NY, 1968, Princeton University Press, NJ, 925 p., (1986)
McClements, D.J. “Ultrasonic Characterization of Emulsions and Suspensions”, Adv. Colloid Int. .Sci., 37, 33-72 (1991)
Rayleigh, J.W. “The Theory of Sound”, Vol.2, Macmillan and Co., NY, second edition 1896, first edition (1878).
Stokes, “On a difficulty in the Theory of Sound”, Phil.Mag., Nov. (1848)
Isakovich, M.A. Zh. Experimental and Theoretical Physics, 18, 907 (1948)
